Do you want to debug your vertex and pixel shader code by stepping through the per-vertex code or the per-pixel code and watching instructions as they are executed, looking at the values in shader constants and variables, and setting breakpoints in trouble spots? The Microsoft DirectX extensions for Microsoft Visual Studio .NET, which we will refer to as the shader debugger, is fully integrated into the Visual Studio .NET Integrated Development Environment (IDE).
In order to prepare for shader debugging, you must install the right tools on your machine. These are listed below. If you already have the right tools installed, you can also try the Goal 5 - Shader Debugging Tutorial. To see more about all the features of the debugger, see Shader Debugger.
Here is a list of some of the operations that you can perform within the IDE while a shader is running:
To prepare for debugging, you must load the right tools on your machine, configure the runtime, and set up your application for debugging. This section will walk you through each of these preparation steps:
Visual Studio .NET provides a compiler and debugging tools for several programming languages within an interactive development environment. The shader debugger is a Visual Studio .NET extension, meaning that it is designed and integrated into Visual Studio .NET. To perform shader debugging with this extension, you will need to have access to Visual Studio .NET. For information about getting Visual Studio .NET as well as the installation instructions, see 2002 or 2003.
The shader debugger is installed as part of the DirectX SDK install. In fact, you must install the SDK for two reasons: you will need the proper debug or reference DLL's, and you will need the shader debugger. The DirectX debug DLL's or the reference DLL can be used to debug vertex shaders, but a reference DLL must be used to debug a pixel shader.
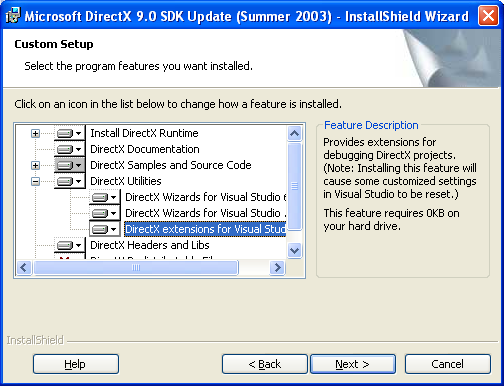
The SDK install wizard takes care of most of this for you, but here is a step-by-step description for installing the SDK and the shader debugger:
In the Custom Setup panel, you will see a listing of all the resources available on the CD. Anything marked with the red X will not be installed. Because we want to debug shaders, we need to make sure the shader debugger will be installed. This is in the DirectX Utilities folder, and is called DirectX extensions for Visual Studio .NET. If this does not have a red X on it, it will be installed. If it does have the red X, left click on the X and select "This feature will be installed on the local hard drive". It should look like this when you are done.

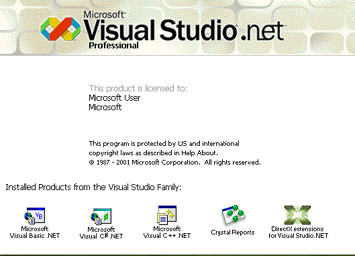
Click Next one more time and wait for the install wizard to finish installing the SDK. This can take a few minutes, especially if you copy all the samples (C++, C#, and VB) to your hard drive. When the install finishes, you will get a message that it was successful. In addition you can now start Visual Studio .NET and check it to see the following on the splash screen when it starts up:

The DirectX extensions for Visual Studio .NET logo in the bottom right corner means that Visual Studio .NET has the extensions loaded, and is now available for shader debugging.
If you are are ready to enable the debug switches in the control panel, then you must already have done the following:
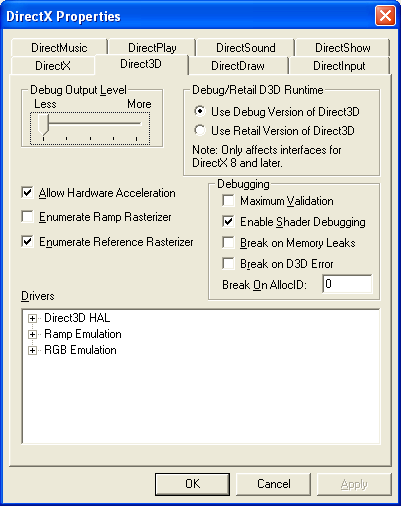
With all the right tools installed, the next step is to enable the debugger settings. This is easily done by launching the DirectX dialog box from the control panel (Start/Control Panel/DirectX). This will open up a dialog box that looks like this:

There are a number of settings on this dialog box, but we are interested in two in particular to enable shader debugging. These are:
The debug mode can also be enabled from within Visual Studio .NET by clicking on Tools | Options | Debugger | DirectX.
This concludes preparing the tools for shader debugging. In summary, you need to rememember to:
To debug a shader, the shader must be running on the right type of Direct3D device since vertex and pixel shaders can only be debugged on certain devices. Once you determine whether you want to debug a vertex shader, a pixel shader, or both, you can use the following table to choose a device type that supports debug.
| HAL Device | HAL Device | REF Device | REF Device | |
|---|---|---|---|---|
| Shader | SWVP | HWVP or pure HWVP | SWVP | HWVP or pure HWVP |
| Vertex Shader | Yes, with the debug runtime | No | Yes, with the debug runtime | No |
| Pixel Shader | No | No | Yes | Yes |
Choose the device type(s) that support the type of shader you want to debug. Then when your application runs create that device type with IDirect3D9::CreateDevice. The SDK samples also use F2 to switch the device type once the sample is running. Any entry in the table that says "No" means that it is not possible to debug that type of shader on that type of device.
With the device type chosen, you can now make the appropriate choice for the shader compile flags. These flags are one or more #defines that are enumerated in D3DXSHADER Flags. These flags are specified at shader creation time when calling functions like D3DXCompileShaderXXX, ID3DXEffectCompiler::CompileShader or ID3DXEffectCompiler::CompileEffect.
Since we want to debug the shader, we need to use these two flags:
If you run into the problem of exceeding instruction slot limits when running unoptimized, there is an additional flag that you can choose. D3DXSHADER_FORCE_VS_SOFTWARE_NOOPT (or D3DXSHADER_FORCE_PS_SOFTWARE_NOOPT) force the compiler to compile against the next higher available software target. Because software shader models do not have instruction slot limits, this flag ensures that unoptimized shaders do not have this problem. This flag still does the other things that the skip optimization flag does, such as preventing instruction reordering and dead code elimination. The shaders will run in software which will reduce their performance.
If you have read this shader debugging tutorial and followed the steps, you are probably debugging a vertex shader already. If you skipped through the tutorial and are still having problems, the table below offers a summary of the problems you may encounter, and what you need to do to solve them. The solutions listed in the table are the same ones covered in the tutorial.
| If you cannot: | You may need to: |
|---|---|
| Launch VS .NET. | Install VS .NET. See Install Visual Studio .NET. |
| See the "DX extensions for VS.NET" icon on the start up screen when you launch Visual Studio .NET or cannot find the debugger menu option Debug, Direct3D, Start With Direct3D Debugging. | Need to install the shader debugger from the SDK. See Install DirectX9 (installing the SDK and the shader debugger from the SDK). |
| Put a breakpoint in your shader code
The shader debugger will give you the following message: "The breakpoint will not currently be hit. No executable code is currently loaded at this location." |
You need to do one or more of the following:
|