This tutorial will launch the debugger and show you how to debug a vertex shader.
If you are having trouble getting the debugger to work, see Goal 5 - Shader Debugging Tutorial to understand the tools you must have installed. Once you have completed the tutorial, many of the debugger features are listed in the Getting Started Debugging Shaders.
The shader debugger tutorial is divided into several tasks:
Launch Visual Studio .NET (either version 2002 or 2003).
If neither of these versions is available, you need to install Visual Studio .NET. Go to Setting Up the Tools for install instructions.
C:\DX90SDK\Samples\C++\Direct3D\BasicHLSL\BasicHLSL
If you cannot find BasicHLSL you may need to install the latest version of the DirectX SDK. For instructions, see Install DirectX9.
//#define DEBUG_VS   // Uncomment this line to debug vertex shaders
//#define DEBUG_PS   // Uncomment this line to debug pixel shaders
The lines should now look like this:
#define DEBUG_VS   // Uncomment this line to debug vertex shaders
#define DEBUG_PS   // Uncomment this line to debug pixel shaders
This sets the correct shader flags so that the shaders can be debugged.
From the Debug menu, click Direct3D then Start With Direct3D Debugging to launch the debugger.
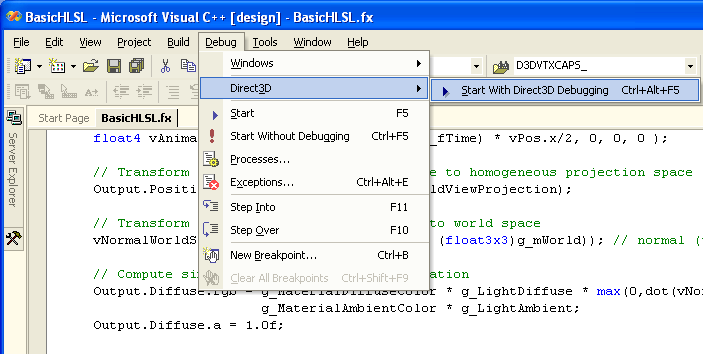
This is also available with shortcut keys CTRL+ALT+F5.
A breakpoint can be set in the code window.
This is what you will see when the debugger breaks. The breakpoint is marked by the filled circle to the left of line 92.
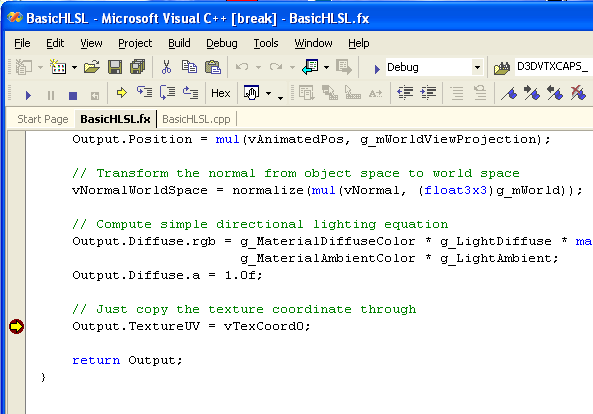
You can now step through one line of code at a time by hitting F10. You can check the contents of any variable or register by placing the mouse over the variable and waiting for the value to pop up.
See Viewing Register Contents or Viewing_Device_State for more options for viewing state.
Disassembly code is a combination of the HLSL shader statements, and the assembly instructions generated by the HLSL compiler. From the Debug menu, click Windows then Disassembly to open the disassembly window.
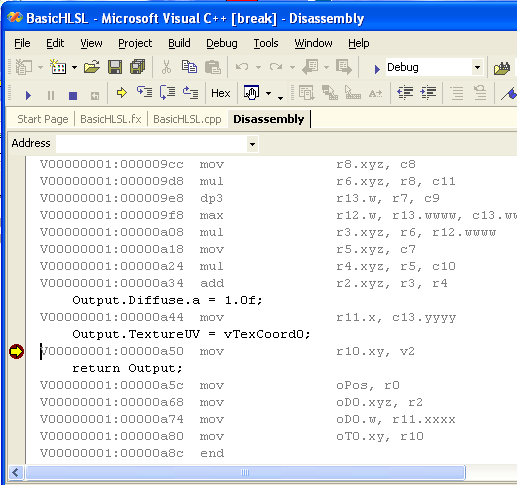
With the shader paused at the breakpoint, you can hold the mouse over individual registers to see the contents, or even drag and drop a register into the watch window to look at the contents.
Once a breakpoint is set, you may need a mechanism for stopping at this breakpoint only if a certain condition is met; for example, after some number of vertices have been processed, or only if a certain normal vector value is seen. This is called a conditional breakpoint because the break only occurs on this condition. Here is an example of how to set one.
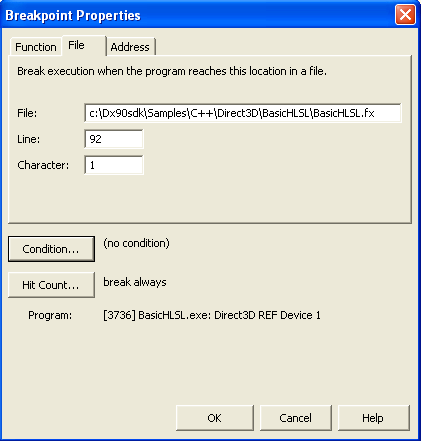
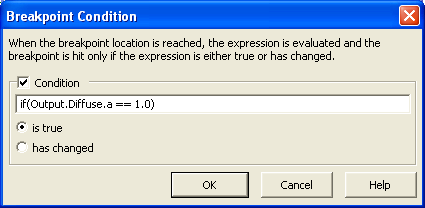
The conditional expression in this example is (Output.Diffuse.a == 1), which means that the debugger will only break on line 92 when the alpha component of the diffuse color is 1. (Since we set alpha to this value, this will always cause a break.) Conditional breakpoints offer a powerful method for fine tuning breakpoints, so that you can look at a particular subset of conditions while debugging.
See Getting Started Debugging Shaders for more options for setting breakpoints and for debugging shader and Direct3D code simultaneously.