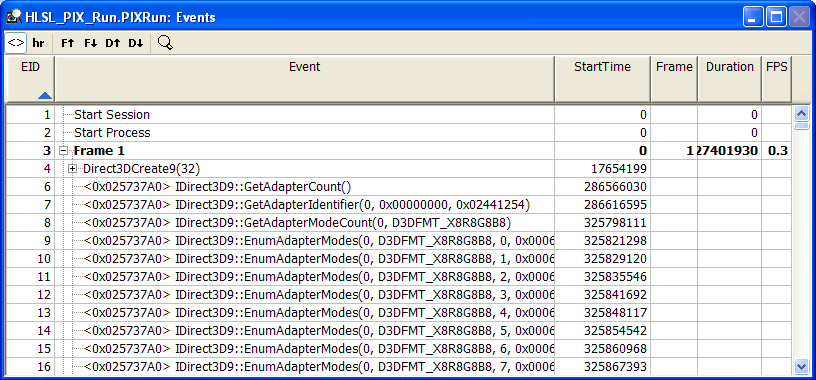
The event view lists the events captured by an experiment. Events are displayed in a table with one event per row.

Initially the event window displays one frame per row, method calls that are captured during each frame are collapsed under that frame event. Expand each frame to display the events captured within that frame. Expanding or collapsing a frame causes the frame to be displayed differently in the timeline view.
The event view displays the events captured in a table.
| Column Name | Description |
|---|---|
| EID | Event ID, which is a unique integer value. |
| Event | Event description. |
| Start Time | Event start time in nanoseconds (ns). This time is measured from the time the application was started. |
| Frame | Frame number |
| Duration | The amount of CPU time to process a frame. |
| FPS | Frames per second |
An event description is dependent on what happens in that event. It could be simply a frame number, or it could be an API call and its associated input parameters. If you captured all the pipeline state in the experiment, the input parameters that represent objects in memory are shown with a blue address (a black address means there is no object data). To view each object, right click on the blue memory address and select the view option from the contextual menu. This will open a tab in the details view.
The event view has a toolbar with the following push-button controls. Use event-view controls to toggle the display of data and navigate between events.
| Symbol | Name | Description |
|---|---|---|
|
|
Pointers | Display object pointers. |
|
|
Return Value | Toggle the display of API call return values. |
|
|
Current Frame | Move forward (up) or backward (down) one frame |
|
|
Draw Call | Move forward (up) or backward (down) to the next draw call. |
|
|
Search | Search for a text string, including a memory address. |
Use the toolbar help navigate the event data and change what is displayed in the window. Use the Pointer button to display (or hide) the this and ppObj pointers. Use the search button to search for specific events. For instance, you can search for an API call, or a memory address within the event view.