The shader debugger supports shader debugging, including setting breakpoints and stepping into shader code. Launch the shader debugger for a pixel shader from the pixel-history tab. Launch the shader debugger for a vertex shader from the mesh tab.

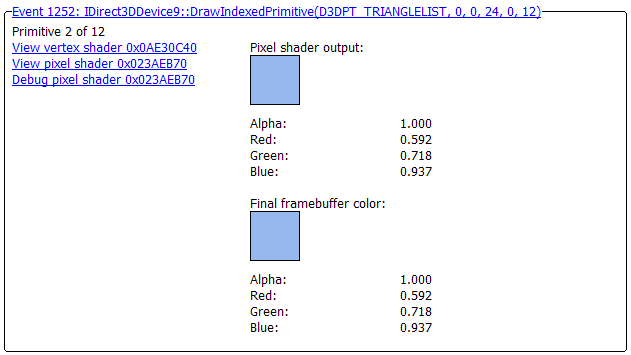
To open the shader debugger, click on the Debug Pixel Shader link. Then find a draw call event that uses a pixel shader. This is easy to do by clicking on either draw button (which finds the next draw call) in the event view.
![]()
The shader debugger has three separate areas of functionality.
The shader debugger uses a toolbar with the following buttons.
| Symbol | Name | Description |
|---|---|---|
|
|
Back | Return to pixel history. |
|
|
Go | Continue to the next breakpoint. |
|
|
Restart | Restart execution at the beginning of the shader. |
|
|
Step | Step to the next executable line of code. |
The shader debugger will always have a disassembly tab. If a shader contains debug information, there will be one or more additional source tabs.

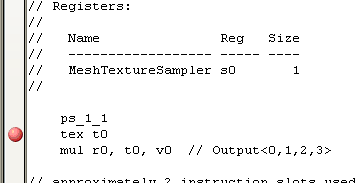
To set a breakpoint in assembly, click down to the left of the line of code you want to stop at. Click on a breakpoint to get rid of it.

Use the buttons in the toolbar to navigate between breakpoints.
This table is a read-only display of shader registers. Once you have stopped on a shader instruction that changes a register value, the register list will be displayed in the table.