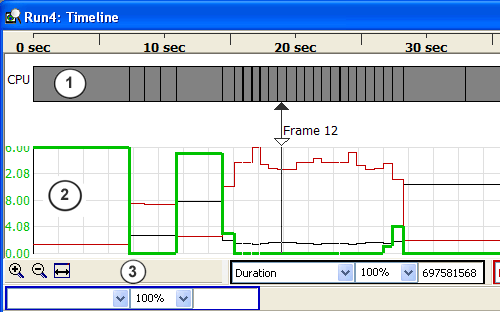
The timeline view displays performance information visually; it makes it easy to see performance bottlenecks. You have control over the amount and types of data displayed.
Figure 1. TimeLine View

There are two types of data displayed: the load on the CPU for each frame, and the data gathered by counters. To make visual debug easier, there is also a set of controls for adjusting the presentation of the data.
The first portion of the timline displays the number of events that are processed by the CPU during each frame. Each frame is displayed using a gray rectangle with a thin black border. Frames that are calculated very quickly appear very narrow, and frames that take longer to calculate appear wider.
Figure 2. CPU Events

The event view shows each frame as a gray rectangle with a thin black border. Slow frames are wider while fast frames are narrower. When viewing frames that have very short durations the view may need to be scaled to see the individual frames.
Use the zoom in button to expand the horizontal scale to see individual events.
To see the elapsed time, use the ruler just above the CPU load bar.
Figure 3. Timeline Ruler

To select a frame, mouse click on the frame arrow and move it left or right.
Figure 4. Frame Arrow

The frame number corresponds to the event selected in the event window. You can also select a frame by clicking down anywhere inside of the timeline.
The second section of the timeline displays counter data (see figure 1). Use the controls on the timeline toolbar to zoom in or out to make viewing easy.
The counter data displayed in the timeline was collected when the experiment was run. Display the data from up to four counters at the same time using the counter controls.
The timeline also supports a toolbar fo adjusting the timeline display (see figure 1). There are two sets of controls: those that adjust the range and position of the data to display, and those that specify which counter data to display.
There are three controls for adjusting the presentation of the data.
| Icon | Name | Description |
|---|---|---|
 |
Zoom In | Zoom in (or expand) the time axis. This has no effect on the scale of the y axis. |
 |
Zoom Out | Zoom out (or compress) the time axis. This has no effect on the scale of the y axis. |
 |
Fit-to-Screen | Change the horizontal scale of the time axis to display all of the time data. |
There are four counter selection boxes. You may use any or all of them to specify up to 4 sets of counter data to display. Each control is color coded to match the color of the counter data in the timeline.
Figure 5. Counter Control

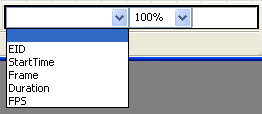
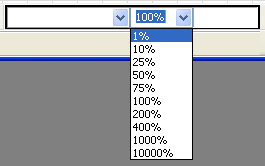
It has two drop down boxes, and a third text box. The first drop down box contains a list of the counter types.
Figure 6. Drop Down #1 - Counter Type

Figure 7. Drop Down #2 - Vertical Scale

Use the vertical scale to fit the data you need to display.
The third portion of a counter control displays the data value. Here is an example of the first control displaying duration data.
Figure 8. Text Box Displays Duration Data
