This tutorial illustrates pixel shader debugging including: setting breakpoints, stepping through pixel shader code, and watching register values.
To set up this experiment, choose the BasicHLSL sample as the target program and select the single-frame-capture option for data collection.
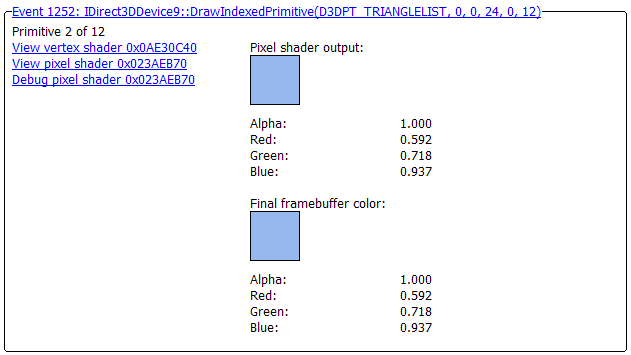
The pixel shader debugger is launched from the debugger tab while viewing pixel history. Click on the Debug pixel shader link to launch the shader debugger. (If you do not know how to access pixel history, see step 1 in the pixel history tutorial)

The debugger tab opens displaying the pixel shader assembly code. The lower section is blank but will be filled in with pixel shader registers when the debugger stops on a line of shader code that uses registers.
![]()
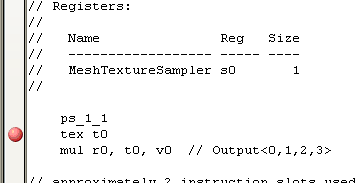
To set one or more breakpoints, click down to the left of the line of shader code.

A red dot will appear marking the breakpoint. (Click on a breakpoint to remove it)
From the shader debugger toolbar click on any of these buttons to start debug.