The mesh tab displays mesh data before and after transformation by the vertex shader; the data is displayed in a table as well as rendered. From the post-transformed vertices, you can launch the vertex shader debugger to walk through and debug vertex shader code.
To set up this experiment, choose the StateManager sample as the target program and select the single-frame-capture option for data collection.
Collect the data and open PIX in analysis mode.
Select a captured frame.
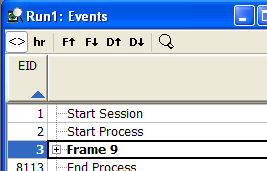
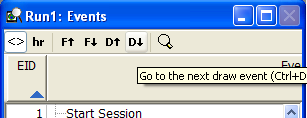
Navigate to a draw event.
Render the frame by clicking on the render tab.
Click on the mesh tab.
The mesh tab opens and defaults to untransformed data, prior to the vertex shader running.
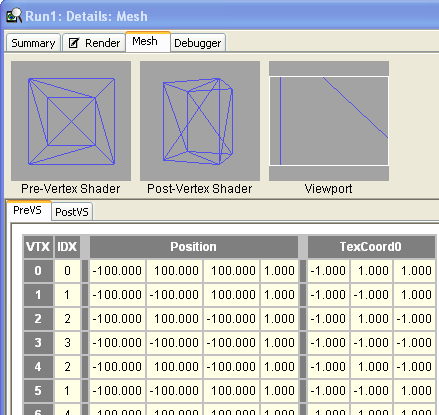
The data in the PreVS tab correspond to the data displayed in the Pre-Vertex Shader display. PIX reads the mesh input declaration and labels the data using the HLSL semantics; you can look at the data by vertex, by index, or by semantic.
To see the transformed mesh data, click on the PostVS tab.
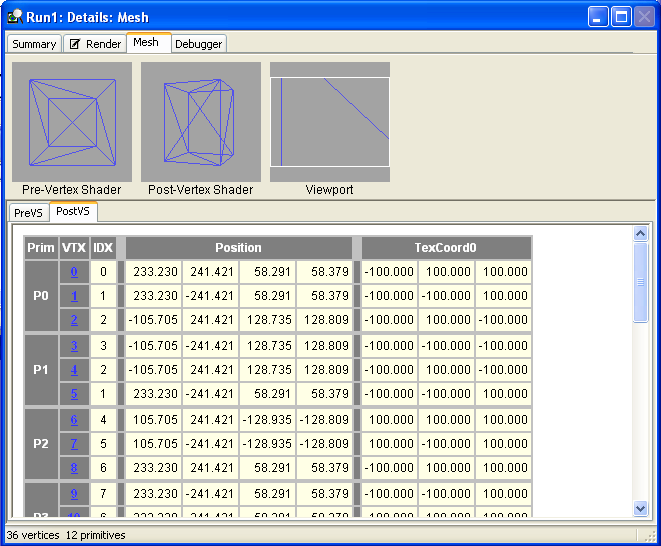
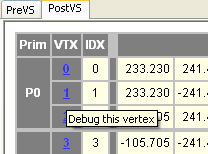
This tab displays the mesh data after the vertex shader has been run. The data in this table, corresponds to the data displayed by the Post-Vertex Shader display. You can look at the data by primitive, by vertex, by index, or by semantic. The vertex data column (VTX) is filled with bold numbers with an underscore. These are links to the vertex shader that transformed the vertices. To launch the shader debugger and debug the vertex shader, click on one of these links.
To step into the shader debugger and debug a vertex shader, pick a primitive and click on one of the blue, bold, underscored vertices (if you hover the mouse over a vertex Debug this vertex will pop up reminding you that this will launch the shader debugger).
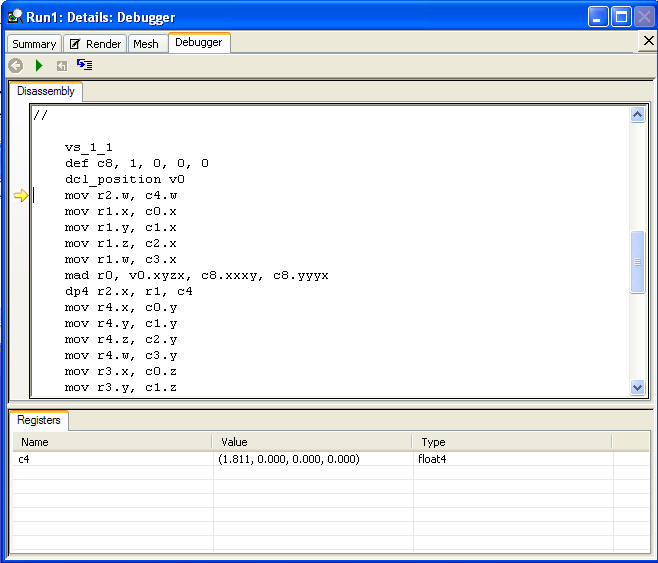
The debugger tab will open displaying the vertex shader assembly code. The cursor (the yellow arrow) marking the line of code that the debugger is paused at, is on the first line of executable code.
For more information about debugging a vertex shader see Debug a Vertex Shader.