Frame statistics are per-frame values that indicate data such as the number of times something happened per frame. Use frame statistics to:
There are two very quick ways to use PIX to find frames which are performing poorly.
The timeline view displays the amount of time it takes the CPU to process each frame.
For instance, here is the CPU load for an entire experiment.
Figure 1. Viewing CPU Processing Time for All Frames

Use the zoom button to expand the horizontal axis to see individual frames more clearly. For instance, this hypothetical example shows many different frames. Arrows mark frames that consume different amounts of time on the CPU.
Figure 2. CPU Load View Expanded to View Individual Frames

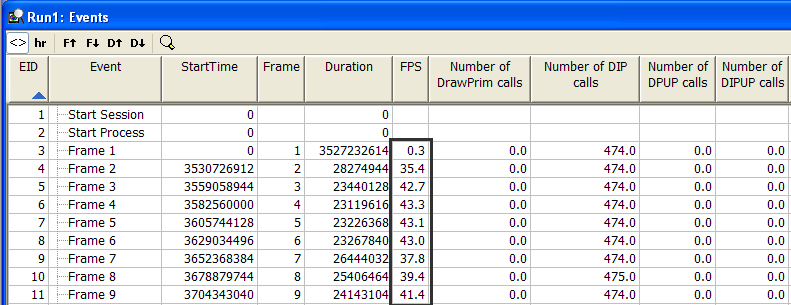
Figure 3. Using the Events View

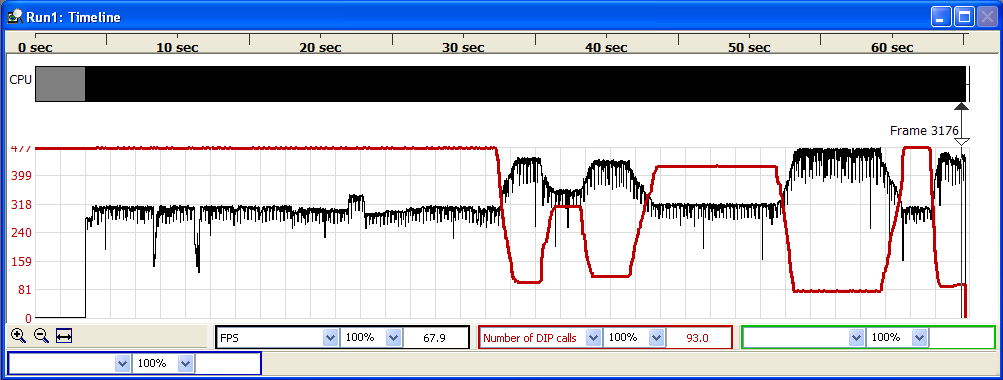
Once you identify fast frames and slow frames, you will probably want to figure out why the slower frames take so long to finish.
Figure 4. Using the Graph in the Timeline View

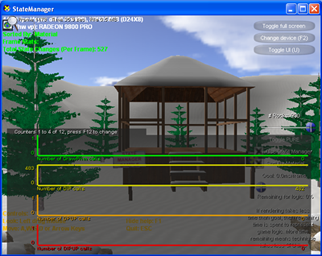
Here is an example of the heads-up-display (HUD) displaying the data that PIX is collecting on an application while it is running.
Figure 5. The HUD and an Application in Realtime

This example uses the StateManager sample. This sample is a good way to see how PIX works. The sample has three controls that vary the amount of rendering work for each frame.
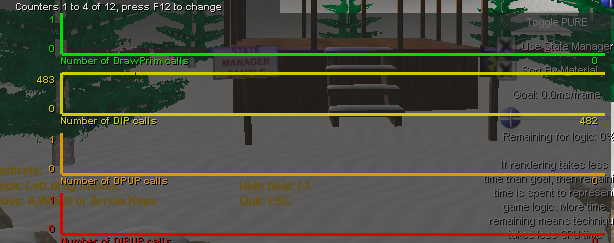
Figure 6. The HUD Counters Actual Size
