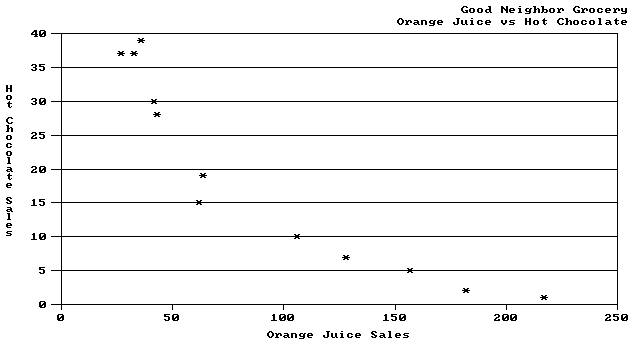
The program SCATTER.C displays a scatter diagram that illustrates the relationship between the sales of orange juice and hot chocolate throughout a 12-month period. Figure 10.5 shows the results of SCATTER.C. Notice that the scatter points form a slightly curved line, indicating that a correlation exists between the sales of the two products. The demand for orange juice is roughly inverse to the demand for hot chocolate.
/* SCATTER.C: Create sample scatter diagram. */
#include <conio.h>
#include <string.h>
#include <graph.h>
#include <pgchart.h>
#define MONTHS 12
typedef enum {FALSE, TRUE} boolean;
/* Orange juice sales */
float far xvalue[MONTHS] =
{
33.0, 27.0, 42.0, 64.0,106.0,157.0,
182.0,217.0,128.0, 62.0, 43.0, 36.0
};
/* Hot chocolate sales */
float far yvalue[MONTHS] =
{
37.0, 37.0, 30.0, 19.0, 10.0, 5.0,
2.0, 1.0, 7.0, 15.0, 28.0, 39.0
};
main()
{
_chartenv env;
int mode = _VRES16COLOR;
/* Set highest video mode available */
if( _setvideomode( _MAXRESMODE ) == 0 )
exit( 0 );
/* Initialize chart library and default
* scatter diagram
*/
_pg_defaultchart( &env, _PG_SCATTERCHART,
_PG_POINTONLY );
/* Add titles and some chart options */
strcpy( env.maintitle.title, “Good Neighbor Grocery” );
env.maintitle.titlecolor = 6;
env.maintitle.justify = _PG_RIGHT;
strcpy( env.subtitle.title,
“Orange Juice vs Hot Chocolate” );
env.subtitle.titlecolor = 6;
env.subtitle.justify = _PG_RIGHT;
env.yaxis.grid = TRUE;
strcpy( env.xaxis.axistitle.title,
“Orange Juice Sales” );
strcpy( env.yaxis.axistitle.title,
“Hot Chocolate Sales” );
env.chartwindow.border = FALSE;
/* Parameters for call to _pg_chartscatter are:
* env - Environment variable
* xvalue - X-axis data
* yvalue - Y-axis data
* MONTHS - Number of data values
*/
if( _pg_chartscatter( &env, xvalue,
yvalue, MONTHS ) )
{
_setvideomode( _DEFAULTMODE );
_outtext( “Error: can't draw chart” );
}
else
{
_getch();
_setvideomode( _DEFAULTMODE );
}
return( 0 );
}
