The Programmer's WorkBench can cut development time and increase your productivity. Its integration allows you to edit, build, run, and debug a program without ever leaving PWB. Its multiwindow display lets you edit several files at once or access online help while still viewing your code. Drop-down menus and mouse support let you perform most functions by clicking the mouse on menu names or by pressing a few keys.
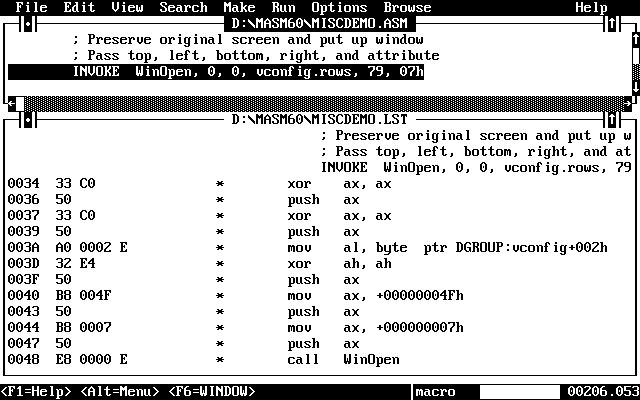
The PWB editor is easy to configure and completely extensible. It combines powerful features such as macros and regular-expression search capabilities with the simplicity of a window-based application (see Figure 1.1).
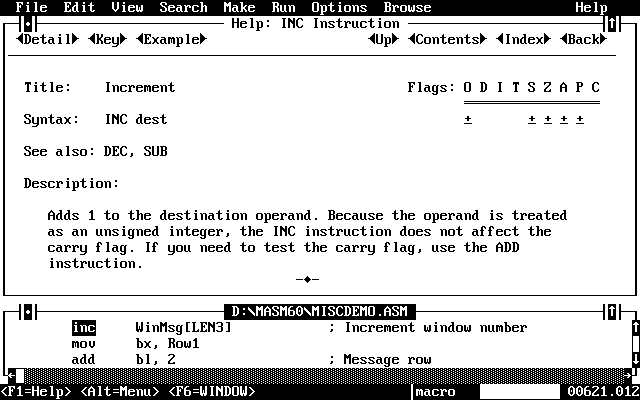
The Microsoft Advisor online reference system provides quick access to information about MASM, PWB, CodeView, the assembler, linker, utilities, and even the reference system itself. Figure 1.2 shows online information about MASM's INC instruction.

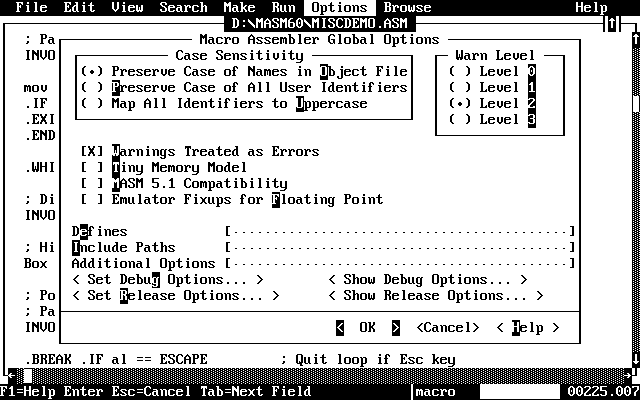
When you're ready to assemble the program, you don't need to remember the full range of command-line assembler options. All options are conveniently located in a PWB dialog box where they can be clicked on or off (see Figure 1.3). Setting options is simply a matter of using the mouse or keyboard to set case, warning level, debug, or release options.
PWB uses the powerful NMAKE tool to speed up development. NMAKE examines each module of a program to determine whether changes have been made that require the module to be reassembled. NMAKE then automatically assembles the modules as necessary and links them. When you're ready to build your program, you just select a single menu command to start the process. PWB invokes NMAKE and builds an application, using the options you set.
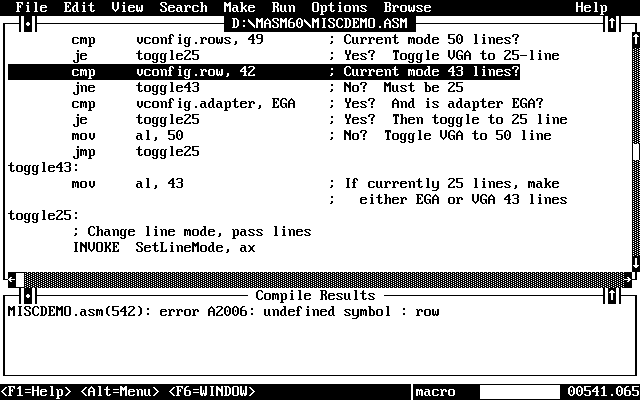
If warnings or errors occur during assembly or linking, PWB opens a window with a full list of assembly or link errors (see Figure 1.4). You can then consult the online reference system for comprehensive information about each error.
Once a program has been successfully built, you can run it from within PWB to test it. If you need to make modifications, you can return directly to PWB to make the changes.
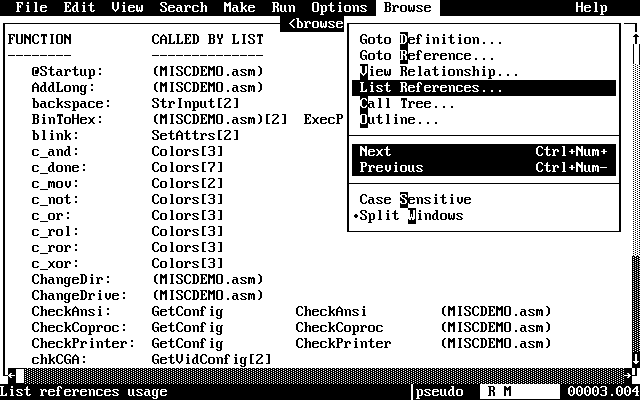
Another useful PWB feature is the Source Browser. With the Browser you can examine your code and display information about procedure and variable relationships (see Figure 1.5). This option is helpful for tracking program flow and isolating bugs.
For bugs that are more difficult to locate and understand, use PWB's Debug Build option, then invoke the CodeView debugger directly from PWB. You can step and trace through your code at the source level while examining variables, registers, and memory (see Figure 1.6).
Once you locate the bug, you can exit CodeView and return directly to PWB, where you can fix the error. When the code is completely debugged, you can build a final release program using PWB's Release Build option.
