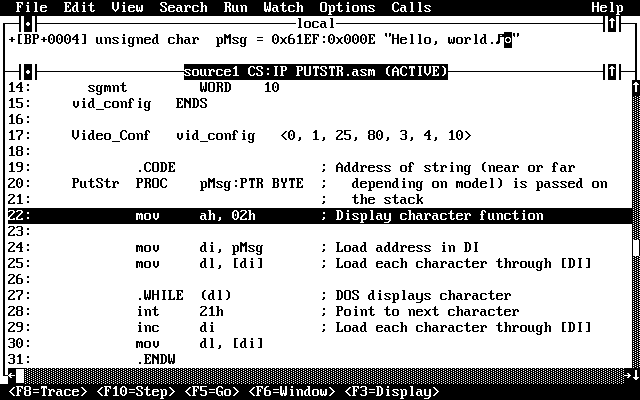
Once a program has been built, you can use the Microsoft CodeView debugger to step through the source code, displaying output, registers, and variables as each line is executed (see Figure 3.8). You can also set breakpoints and watchpoints to cause execution to pause at critical sections of code. From within CodeView, the Microsoft Advisor can provide online help about CodeView operation, options, and MASM keywords in the source code. Although you can call CodeView from the command line, PWB provides access to CodeView without exiting. See Chapter 15 in the Programmer's Guide for more information about using CodeView.
NOTE:
CodeView version 3.12 is compatible with releases of OS/2 later than version 1.0. If you have problems exiting CodeView, you have either an older version of OS/2 or the wrong version of the DOSCALLS.DLL file.
If you use CodeView from the OS/2 DOS compatibility box, be sure the /S (Swap Screen in Buffers) option is set in the CodeView Options dialog box. If the option is not set, the mouse cursor is not displayed while you are debugging.

It's easy to create a debug version of a program so it can be examined with CodeView.
Choose MASM Options in the Options menu; then select the Set Debug Options button. This dialog box contains a variety of settings for a debug build. Although most of the options can be set to your preference, you must check the CodeView option under the Debug Information heading.
The CodeView Options command in the PWB Options menu provides a variety of choices for configuring CodeView. These include two-monitor debugging, memory allocation, and selecting the number of lines on the screen. For now, use the default settings initially displayed.
For the assembler to build a program containing the necessary CodeView information, you must check the Debug option, which is set in the dialog box displayed by the Build Options command in the Options menu. You must also select the CodeView option (which is on by default) in the Set Debug Options dialog box accessed from the MASM Options command in the Options menu.
To demonstrate how CodeView works, set the debug options as listed above, then rebuild the HELLO.ASM program using the Rebuild All command in the Make menu.
After your program has been built with the appropriate debug options, choose the Debug command from the Run menu. PWB immediately transfers control to CodeView, loading the current project as indicated in the program list.
When you switch from PWB to CodeView, the program appears in the Source window. The Source command in the Options menu displays your program in one of the following ways:
 As source code from your MASM source-code file. This is the default display.
 As assembly language generated by CodeView disassembling the program's executable file.
 As a mix of these two, with the disassembled code following the corresponding source code.
The mixed-code option is especially useful when your program contains macros or directives that generate code; you can see how the assembler converted them into machine instructions.
In addition to showing source code, commands in the View menu show windows displaying memory, registers, and local variables. All windows are similar to PWB windows; they can be scrolled, sized, and closed. You can have multiple windows on one screen, displaying a variety of information. A list of shortcut keys and buttons appears at the bottom of the screen.
A “watch expression” is a program variable that CodeView continually monitors. Watch expressions are displayed using the Watch command from the View menu. As the value of a variable changes, the value also changes in the watch window.
To add a variable to the watch expression list, position the cursor anywhere within the variable and choose the Add Watch command from the Watch menu. You can also type the variable name in the dialog box. Remove watch expressions using the Delete Watch command from the Watch menu, or position the cursor on that expression's line in the Watch window and press CTRL+Y.
To set a watch variable in the HELLO.ASM file, use the cursor to highlight the pMsg variable in the CodeView Source window. Then choose the Add Watch command from the Watch menu. The pMsg variable appears in the Expression text box. Press END to position the cursor at the end of the name, and then type ,s (so that CodeView displays the data at this address as a string). Press ENTER or click the OK button to add this variable to the Watch window. The Watch window gives a “Watch Expression Not in Context” error until you trace into the PutStr procedure.
CodeView also incorporates a temporary watch option called Quick Watch. Highlight a variable in the Source window with the mouse or cursor. Choose the Quick Watch command from the Watch menu. A dialog box appears giving the current value of the variable. You can add any Quick Watch variable to the watch window using the Add Watch dialog box option.
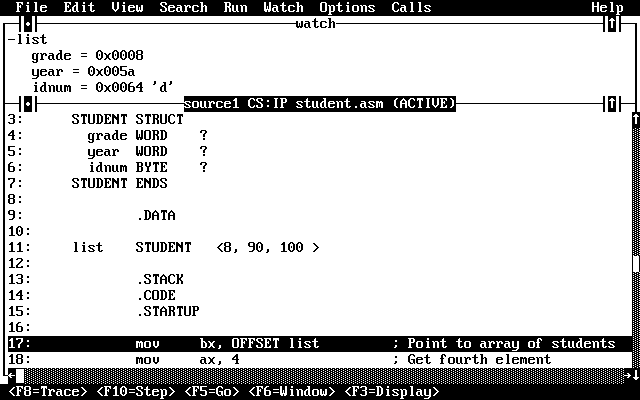
You can expand any structures or arrays that are set as watch expressions (identified with a + in the Watch window) to show individual elements. Position the cursor on the variable name and either double-click the left mouse button or press ENTER (see Figure 3.9).

A “breakpoint” is an instruction that tells CodeView to interrupt execution at a certain location or when an expression becomes true.
Use breakpoints to cause execution of the program to pause before an error occurs and to move quickly to a part of the program you want to trace. When CodeView stops at a breakpoint, you can single-step or trace through instructions until you find the problem.
Set a breakpoint by positioning the cursor on the line at which you want the program to stop and then pressing F9. You can also choose the Set Breakpoint command from the Watch menu. A dialog box presents a series of options for setting types of breakpoints. You can modify or delete breakpoints using the Edit Breakpoints command from the Watch menu.
Set a breakpoint in the HELLO.ASM file by moving the cursor in the CodeView Source window to the line that reads
INVOKE PutStr, ADDR msg
From the Watch menu, choose the Set Breakpoint command. The number of the line the cursor appears on is displayed in the dialog box. Press ENTER or click the OK button to store the breakpoint. After the breakpoint has been set on a line, that line is highlighted.
CodeView offers several ways to run a program. You can let the program execute at full speed or view each line as it executes. Table 3.2 lists the CodeView run commands.
Table 3.2 CodeView Run Commands
| Name | Use | Key |
| Go | Executes the program to the next breakpoint, error, or end of the program | F5 |
| Trace | Executes a single line | F8 |
| Step | Executes a single line, but doesn't trace into functions | F10 |
Enter run commands by pressing the appropriate key or clicking the commands at the bottom of the screen. The Trace and Step commands highlight each line as it executes. The Go command simply executes (without highlighting) until the program stops at an error, a breakpoint, or the end. If you choose the Animate option for the Go command, CodeView highlights each line as it executes. To force execution to start at the beginning of the program, use the Restart command in the Run menu.
You can either single-step through a program or use the Animate command in the Run menu to step through the program automatically, highlighting each line as it proceeds.
If a program requires arguments to be passed from the command line, these arguments can be entered with the Set Runtime Arguments command from the Run menu.