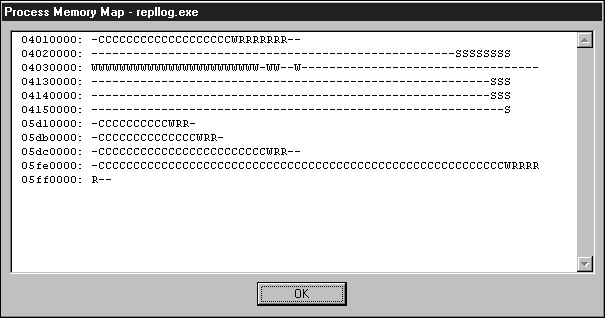
The second menu command in the Remote Memory Viewer that helps you understand how your application uses memory is the Process Memory Map command. This command opens the Process Memory Map dialog box, which provides a detailed picture of how a selected process uses memory.

Process Memory Map dialog box
Each line of text in the Process Memory Map dialog box begins with the address of a 64 KB region of memory. Symbols indicating how a process allocates pages in this region are described in the following table.
| Symbol | Description |
|---|---|
| S | Stack page |
| C | Code page in ROM |
| c | Code page in RAM |
| W | Read/write data page in RAM |
| R | Read-only data page in ROM |
| r | Read-only data page in RAM |
| O | Object store page |
| P | Pending commit |
| - | Reserved page available for commitment |
Any white space at the end of a line represents the amount of wasted free space.