

Index
Topic Contents
Previous Topic: List of Filters and Samples
Next Topic: Using the Filter Graph Editor
 |
 | 
|

|
| |||
| |||
About the DirectShow Filter Graph Editor
The Microsoft® DirectShow™ SDK provides the Filter Graph Editor tool (also referred to as "Graphedt.exe" or "GraphEdit") that you can use to create, edit, and save filter graphs. This article introduces GraphEdit, and discusses the purpose of the buttons on the GraphEdit toolbar in About the GraphEdit Toolbar. See Using the Filter Graph Editor for detailed information about how to use GraphEdit.
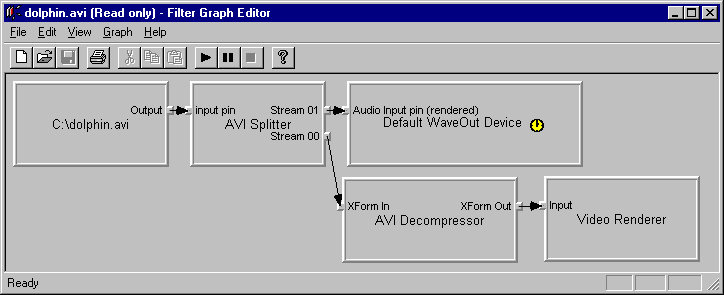
The DirectShow architecture uses filter graphs to manage multimedia streams in Microsoft Windows® 95 and Microsoft Windows NT®. A filter graph consists of a set of filters connected in sequence; the sequence typically includes a source filter reading from a media file, a transform filter, and a renderer, although your graph will vary depending on its purpose. A graph to play a media file with video and audio typically includes a source filter, a stream splitter, a video decompression filter, and appropriate renderers. The following screen shot shows a filter graph in GraphEdit that includes both audio and video streams.

GraphEdit helps you visualize a filter graph as shown in the preceding screen shot. A rectangle represents a filter, with tiny attached squares representing pins. Pins are key to understanding DirectShow, from format negotiation to data transportation. Arrows joining the pins represent data flow paths, much like a pipe directs the flow of water. GraphEdit displays input pins on the left side of the filter's rectangle and output pins on the right side. Output pins might not be present until you connect an input pin. Input pins only connect to output pins, and vice versa.
GraphEdit indicates the audio renderer that provides the clock for the filter graph by a small yellow-filled clock symbol within the audio renderer's rectangle. You can disable the clock by canceling the selection of Use Clock on the Graph menu. Graphs without clocks play the audio and video streams as fast as possible, independently of each other.
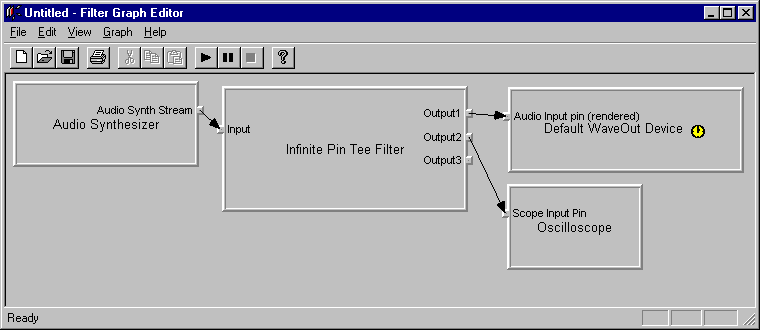
The following filter graph plays back audio from the Audio Synthesizer source filter (Synth). Synth generates its own audio data rather than reading data from a file. The audio renderer's clock is enabled in this filter graph.

The following filter graph is one of the simplest possible filter graphs. The Bouncing Ball source filter generates video data and the video renderer filter displays it.
About the GraphEdit Toolbar
GraphEdit's toolbar appears beneath the menu bar. It provides shortcut commands for opening new filter graphs, saving the current filter graph, and playing, pausing, or stopping the multimedia source file. You can display or hide the toolbar by clicking Toolbar on the View menu.
Button Effect Creates a new, empty filter graph. Opens an existing multimedia source file or an existing filter graph (.grf) file. Saves the current filter graph as a filter graph (.grf) file. Prints the current filter graph. Plays the multimedia source using the current filter graph. Pauses play of the multimedia source. Stops play of the multimedia source. Displays Help information for GraphEdit. © 1998 Microsoft Corporation. All rights reserved. Terms of Use.