 To start SQL Performance Monitor
When you install SQL Server, the setup program automatically installs a SQL Performance Monitor icon in the Microsoft SQL Server 6.0 program group.
 To start SQL Performance Monitor

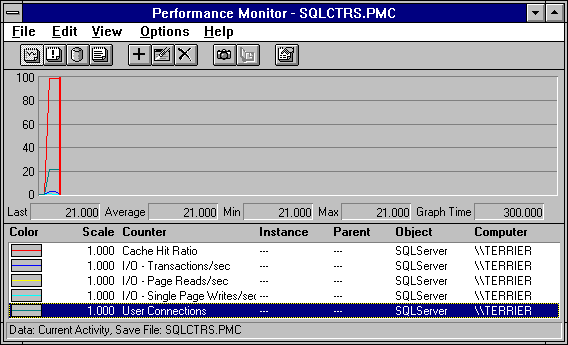
The Performance Monitor window appears.

By default, when SQL Performance Monitor is started, it monitors a predefined set of SQL Server counters. It displays:
You can configure SQL Performance Monitor to display statistics from any of the SQL Server counters. For information on configuring and using SQL Performance Monitor, see the Performance Manager online Help. For information about the statistics returned by each SQL Server counter, see Objects and Counters, later in this chapter.
SQL Server statistics are displayed only when SQL Server is running. If you stop and then restart SQL Server, the display of SQL Server statistics is interrupted and then automatically resumed.
As with all performance monitoring tools, you should expect some performance overhead when monitoring SQL Server using the Performance Monitor. In tests using the default SQL Server counters defined in the SQL Server program group, the monitoring overhead was found to be less than 5 percent on a single processor computer, and a negligible amount on a multiprocessor machine. Note, however, that these results are to be used only as guidelines about what to expect; the actual overhead in any specific instance will depend on the hardware platform, the number of counters, and the update interval selected.
If the server is running SQL Server integrated security, Performance Monitor can be run only by a SQL Server user who has SA privileges. If the server is not running integrated security, the probe user ID is used to retrieve the values displayed in Performance Monitor. In this case, be aware that if you delete the probe user ID, you will not be able to use Performance Monitor.
If you want to run Performance Monitor without SQL Server running, you can increase the response time by disabling the SQL Performance Monitor Integration option. This is a server option set that uses SQL Setup or SQL Enterprise Manager. For more information, see Chapter 3, Configuring Servers.
For additional information about displaying statistics and for information about setting alerts based on thresholds reported by these statistics, see your documentation for Windows NT.