 To start SQL Trace from the command line
Microsoft SQL Trace is a graphical utility that monitors and records SQL Server 6.5 database activity. SQL Trace can display all server activity in real time or create filters that focus on the actions of particular users, applications, or host servers. SQL Trace can display any SQL statements or remote procedure calls (RPCs) that are sent to any Microsoft SQL Server 6.5 server. SQL Trace also records connections and disconnections made to and from the server. SQL Trace activity can be saved to disk in an ISQL/w-compatible script or as an activity log.
All events can be annotated with SQL Server login name, Windows NT domain\username, application name, and host name (where available). The statistics start time, end time, duration, CPU usage, reads, and synchronous writes are avaliable for all events. For language and RPC events, the statistics refer to the individual events. For events such as disconnection, the statistics refer to the complete session. Complete session statistics can be used for auditing.
SQL Trace provides a graphical user interface to the extended stored procedure xp_sqltrace. Many of the features provided by SQL Trace can also be achieved programmatically by using xp_sqltrace directly. For example, by creating an auto-start stored procedure that calls xp_sqltrace, it is possible to automatically start SQL Server auditing.
SQL Trace is installed with SQL Server 6.5 server software and, optionally, with the 32-bit client software.
 To start SQL Trace from the command line
sqltrace /Uusername /Ppassword /E /Hhostname /Ffilter
where
 To start SQL Trace from the user interface
![]()
The Connect Server dialog box appears.
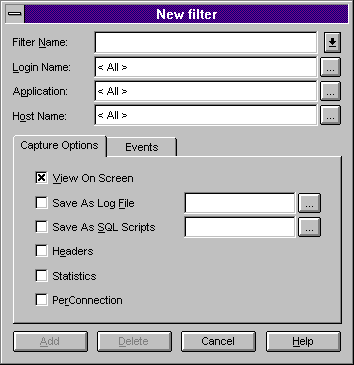
If filters have been defined for the selected server, the Start Selected Filters dialog box appears. If filters have not been defined for the selected server, a dialog box appears in which you can choose to create a filter. When you choose Yes, the New Filter dialog box appears.

 To create a filter
Or
Or
For more information about New Filter dialog box options, from the New Filter dialog box choose Help.
You can modify or delete an existing filter by using the Filter Properties dialog box.
 To modify a filter
Or
Or
For more information about Filter Properties dialog box options, from the Filter Properties dialog box, choose Help.
You can delete an inactive filter.
 To delete a filter
Complete the Delete Selected Filters dialog box that appears.
Or
Or
For more information about Delete Selected Filters dialog box options, from the Delete Selected Filters dialog box, choose Help.

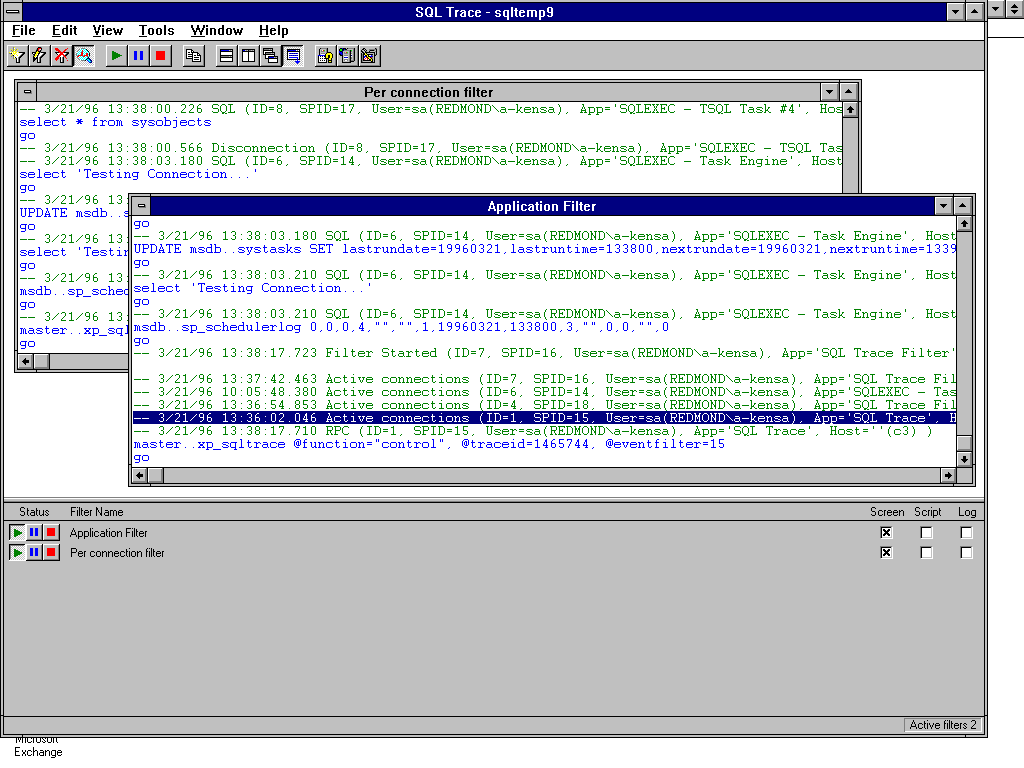
The SQL Trace window contains the following elements.
| Element | Description |
|---|---|
| SQL Trace title bar | Displays the name of the connected server. |
| Active Filter pane | Displays the activity of the named filter and the requests that are coming to the server named in the SQL Trace title bar. The Active Filter pane title bar displays the filter name. |
| Filter Status pane | Lists the filters that are currently defined on the server, displays information about these filters, and provides Start, Pause, and Stop buttons. |
| Screen check box | Specifies whether to display filter activity in the Active Filter pane. |
| Script check box | Specifies whether to save filter activity as an SQL script. |
| Log check box | Specifies whether to save filter activity to a log. |
| Active Filters box | Displays in the lower, right-hand corner of the status bar the number of active filters. To display the Active Filters box, from the View menu, select Statusbar. To hide the Active Filters box, from the View menu, clear Statusbar. |
 To control filter activity from the Filter Status pane

To start a filter, choose the right-pointing arrow Start button.

To pause a filter, choose, the parallel vertical bars Pause button.

To stop a filter, choose the solid box Stop button.
 To modify a filter from the Filter Status pane
For more information about configuring and using SQL Trace, see the SQL Trace online Help.