Windows NT only
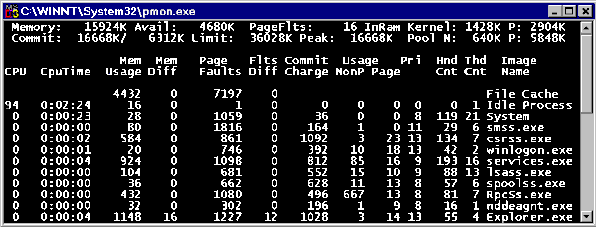
The PMon utility is available in Windows NT, but it is not installed by default. The PMon utility shows the memory usage of each running process, and of the cache, in a console window. PMon updates its statistics every five seconds. A sample is shown following.

At the top of the display are some system global statistics: memory size and available bytes, the virtual memory commitment, and pool sizes.
Then, for each process, PMon shows processor usage during the last update interval. The CPU Time column shows total processor time in the format hours:minutes:seconds. The Mem Usage column shows how many pages each process is using, and the Mem Diff column shows the change since the last update. The Page Faults column shows how many page faults have occurred in the process, and the Flts Diff column shows the change since the last update. The Commit Charge column shows the number of writable nonshared pages for the process. The Usage: NonP column shows the nonpaged pool usage and the Usage: Page column shows the paged pool usage. The Pri column shows the process priority, the Hnd Cnt column shows the number of handles owned by the process, and the Thd Cnt column shows the number of threads for the process. This same information is covered by the Performance Monitor, but this is a handy subset of information that does not require counters to be selected, as Performance Monitor does.
PMon also provides a keyboard interface. Use the up and down arrow keys to scroll up and down the list of currently running processes. Use ESC or q to exit PMon. Use any other key to have PMon refresh its display immediately.