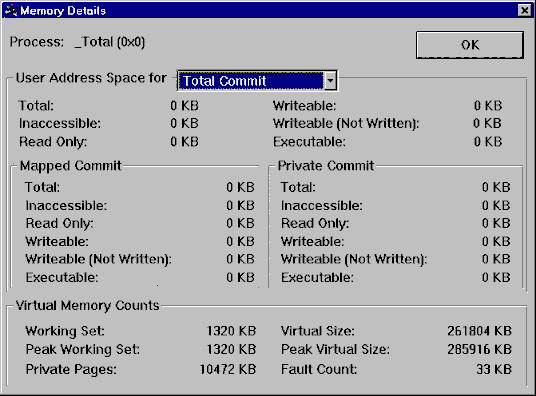
The Memory Details dialog box (see the following figure) gives information on the process selected by the Process Selection box in the main PView dialog box. To update the information contained in this dialog box, return to the main dialog box and click on the Refresh button.
This dialog box consists of the following fields:
| Field | Description |
|---|---|
| Process | The name and process ID of the process selected in the Process Selection box of the main dialog. |
| User Address Space | Displays statistics for specific .EXE or .DLL files or "Total Commit," which displays statistics for all components of the currently selected process. |
| Mapped Commit | Consists of pagefile-backed shared memory regions. |
| Private Commit | Consists of writeable pages that are not shared; they are private to that process, usually created with LocalAlloc or VirtualAlloc. |
| Virtual Memory Counts | Displays statistics on Virtual Memory usage. |
The statistics used are the following:
| Statistic | Description |
|---|---|
| Inaccessible | Address space that cannot be accessed. This includes memory reserved by VirtualAlloc. |
| Read Only | Read-only data and code. |
| Writeable | Total data address space that can be written to. |
| Writeable (Not Written) | Data address space that can be written to, but has not been. |
| Executable | Code in selected EXEs and DLLs. |
| Working Set | Average amount of virtual memory used by the process. The longer a process has been running, the more accurate this value is. |
| Peak Working Set | Maximum value attained by the Working Set described above. |
| Private Pages | Number of pages marked as private. |
| Virtual Size | Current size of virtual memory for this process. |
| Peak Virtual Size | Maximum size of virtual memory for this process. |
| Fault Count | Number of page faults. Each page fault represents an attempt to access memory at an address that was not in physical memory. |