Adam Shapiro
The query optimizer evaluates each SQL statement and determines the best plan of execution.
Understanding how the query optimizer works will help you write better queries and create useful indexes.

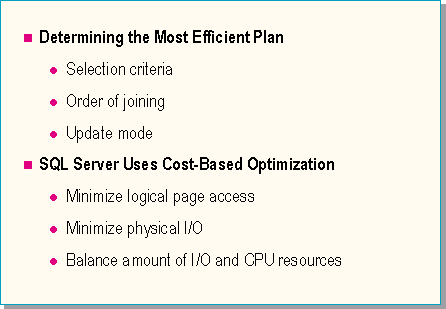
Determining the most efficient plan
The query optimizer determines the best plan for retrieving data and the order of execution for data manipulation queries, such as SELECT, INSERT, UPDATE, and DELETE. The query optimizer produces a query plan that outlines the sequence of steps required to perform the query. The optimizer can only optimize the processes of finding rows, joining rows, and ordering rows.
SQL Server uses cost-based optimization
A cost-based optimizer evaluates each query plan generated and estimates the cost of executing the plan in terms of the number of rows returned and the amount of physical disk I/O required for each relational operation.
A cost-based optimizer uses its knowledge of underlying data and storage structures such as table size, table structure, and available indexes. It also estimates the selectivity of each relational operation based on the statistics kept for each index.
By evaluating various orderings of the relational operations required to produce the results set, a cost-based optimizer arrives at an execution plan that has the lowest estimated cost in terms of system overhead.
The cost estimates can only be as accurate as the available statistical data that estimates the selectivity of each relational operation.
Performance of a query is determined by the speed of the individual tactics and by whether an efficient join order was selected. The query optimizer chooses to limit the number of choices it considers, so it can run in a reasonable amount of time.
Performance is also measured by the amount of logical and physical page access.
The query optimizer considers both logical and physical access to evaluate the cost of a query plan. It also takes into account that a fixed percentage of pages are in cache.
The query optimizer evaluates strategies to find the one with the least amount of work, which is the accumulation of CPU and I/O time. The amount of physical I/O is used to measure this. The goal is to reduce the amount of physical I/O.
Understanding how the query optimizer works should provide you with insights to help you write better queries, choose better indexes, and detect performance problems.
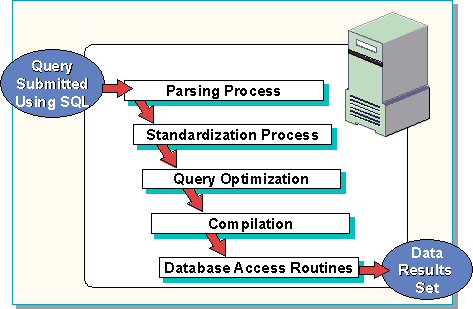
After a query is submitted to SQL Server, several steps occur to transform the original query into a format that the optimizer can interpret. The following briefly outlines the steps that must occur before the query can be processed and a results set returned.
Parsing process
The parsing process checks the incoming query for correct syntax and breaks down the syntax into component parts that can be understood by the relational database management system. The output of this step is a parsed query tree.
Standardization process
The standardization process transforms a query into a useful format for optimization. Any redundant syntax clauses that are detected are removed. Subqueries are flattened if possible. The output of this step is a standardized query tree.
Query optimization
The query optimizer produces an efficient query plan for processing the query. There are three steps involved in this phase: query analysis, index selection, and join selection. The query optimizer automatically limits the number of possible execution plans. The output of this step is called an execution plan or a query plan.
Compilation
The code is compiled into executable code.
Database access routines
The optimizer has determined the best method to access data, choosing to perform a table scan or use an available index. That method is now applied.
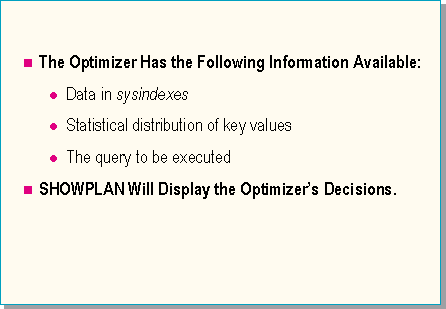
The query optimizer analyzes the information it has available to determine the best choice of query plan.
The sysindexes table
The optimizer can use the following information in sysindexes:
| Column Name | Description |
| indid |
ID of the index. Possible values are: 0 Table (nonclustered table) 1 Clustered index >1 Nonclustered 255 Entry for tables that have text or image data |
| dpages | For indid = 0 or indid = 1, dpages is the count of used data-only pages. For indid = 255, rows is set to 0. Otherwise dpages is the count of leaf-level index pages. |
| rows | The data-level row count based on indid = 0 or indid = 1. This value is repeated for indid > 1. For indid = 255, rows is set to 0. |
| distribution | Pointer to distribution page (if entry is an index). |
| rowpage | Maximum count of rows per page. |
| minlen | Minimum size of a row. |
| maxlen | Maximum size of a row. |
| maxirow | Maximum size of a nonleaf index row |
| keys1 | Description of key columns (if entry is an index). |
| keys2 | Description of key columns (if entry is an index). |
| soid | Sort order ID that the index was created with; 0 if there is no character data in the keys. |
| csid | Character set ID that the index was created with; 0 if there is no character data in the keys. |
Statistical distribution of key values
This information is found on the distribution page.
The query to be executed
The query gives the optimizer the selection criteria it needs to determine which index, if any, would be most useful. The way that row qualifications are expressed in the query can affect the optimizer’s decisions.
SHOWPLAN
This SET statement option will report the optimizer’s final decision on which indexes have been selected for use with which tables, the order in which the tables will be joined, and the update mode selected. Work tables and other strategies are also reported in the SHOWPLAN output.
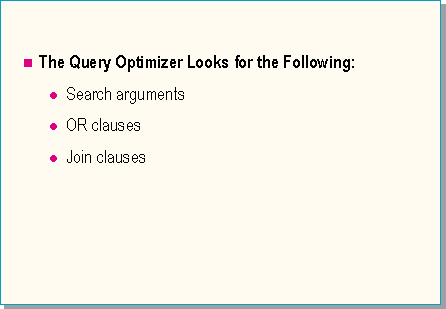
The first phase of the query optimizer is called query analysis. In this phase the optimizer looks at each clause that was parsed and determines whether it can be optimized. Clauses that can be optimized are those that limit a scan - for example, those containing a search argument or join clause. For those clauses that can be optimized, the optimizer determines whether there is an appropriate index.
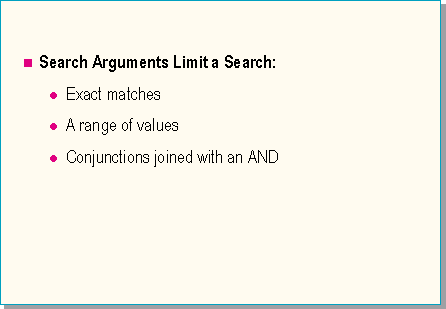
A search argument limits a search because it is very specific in the information it is requesting. It specifies an exact match, a range of values, or a conjunction of two or more items joined by an AND operator. A search argument contains a constant expression that acts on a column using an operator.
<column> <inclusive operator> <constant> [AND...]
OR
<constant> <inclusive operator> <column> [AND...]
Examples
name = 'jones'
salary > 40000
60000 < salary
department = 'sales'
name = 'jones' AND salary > 100000
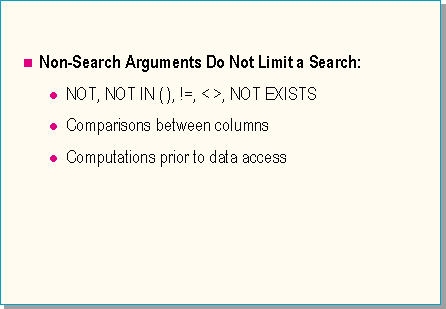
If an expression does not limit a search, it is considered a non-search argument. This includes expressions that are exclusive rather than inclusive.
For example, a not-equal (!=) expression must first look at all the data before it can determine which data does not fit the search criteria.
Another example is a comparison between columns, such as:
salary = commission
Because both columns are contained in the table itself, an index may not be very useful.
Another example is one that involves computation prior to data access. For example:
salary * 12 > 36000
In this case, the salary column must be accessed and the calculation performed before SQL Server can determine whether a row qualifies.
Class discussion
What are the search arguments in the following query?
SELECT COUNT(*)
FROM dept, empl, job
WHERE empl.age > 30
AND (dept.floor = 2 OR dept.floor = 3)
AND job.rate > $20.00
AND empl.jobno = job.jobno
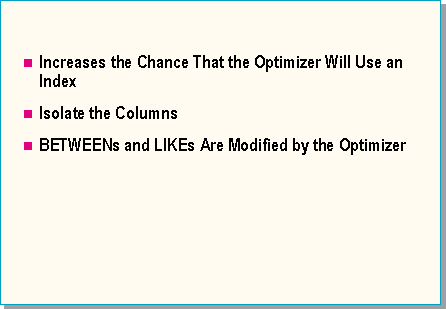
In many cases, non-search arguments can be rewritten into search arguments. A query that contains a search argument increases the chances that the optimizer will select an index.
Expressions that involve computations on a column can be converted into a search argument by isolating the column.
WHERE price * 12 = 100WHERE price = 100/12Tip When writing queries, keep the column information on one side of the operator and the search criterion on the other.
Some expressions are internally modified by the query optimizer into search arguments, such as BETWEENs and LIKEs.
name LIKE 'jo%'. This is the same as name ³ 'jo' AND name < 'jp'. The expression name LIKE '%jo' is not a search argument because it does not limit the search.Using non-search arguments to avoid the use of an index
If you want the query optimizer to avoid selecting a particular index, you can use a non-search argument in the search clause - for example, add a zero to the column as follows:
salary + 0 > 30000
This statement guarantees that the optimizer will not evaluate an index on salary.
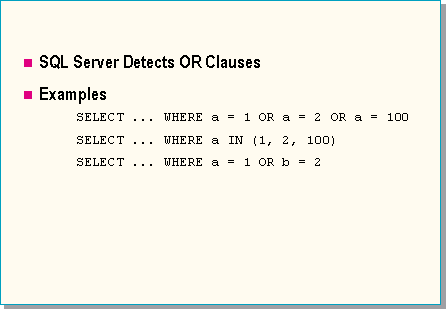
OR clauses are mentioned here because they are detected as part of query analysis. They will be covered in much more detail later.

Retrieving data from two or more tables requires a join clause. A join clause links the data from various tables in the same database or in different databases.
A self-join is also an example of a join clause.
Example
SELECT e1.manager_name, e2.name
FROM empl e1, empl e2
WHERE e1.emplno = e2.manager_no
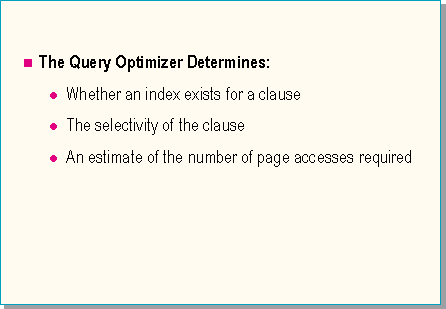
Index selection is the second phase of query optimization. During this phase, the query optimizer determines whether an index exists for a clause, assesses the usefulness by determining the selectivity of the clause (how many rows will be returned), and estimates the number of page accesses (both logical and physical) required to find the qualifying rows.
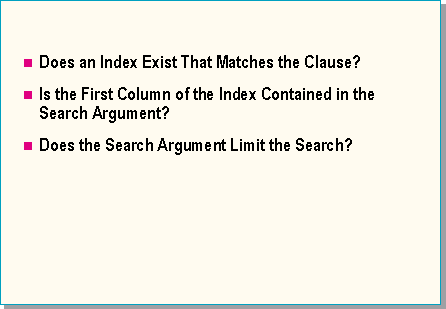
The first step in determining whether a useful index exists is to check for an index that matches the clause.
An index is useful if:
Considerations
The query optimizer can evaluate using a nonclustered index if the high-order column is specified in the WHERE clause.
The query optimizer can always evaluate a covering index regardless of whether the indexed column is specified in the WHERE clause.
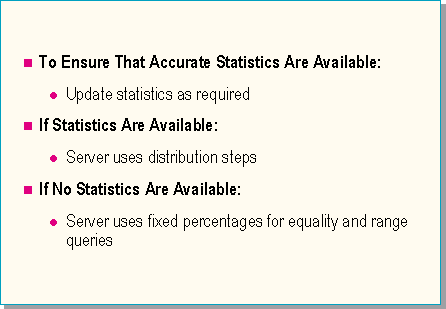
If statistics are available
After a useful index is found that matches the clause, its usefulness is assessed by determining the selectivity of the clause. Even if a useful index is present, it may not be used if the optimizer determines that index access is not the best access method. The selectivity is determined by estimating the number of rows that satisfy the clause. If statistics are available, the server evaluates indexes using the distribution steps.
If no statistics are available
If no statistics are available, the server uses fixed percentages depending on the operator.
The optimizer uses the following defaults if no statistics are available:
| Operator | Assumed Percentage of Rows |
| = | 10% |
| > | 33% |
| < | 33% |
| BETWEEN | 25% |
A special case is when the optimizer recognizes that there is an equality in the WHERE clause and the index is unique. Because this is an exact match and always returns one row, the optimizer doesn’t have to use statistics.
There will be no statistics available if the index was created before there was any data in the table, or if the table has been truncated.
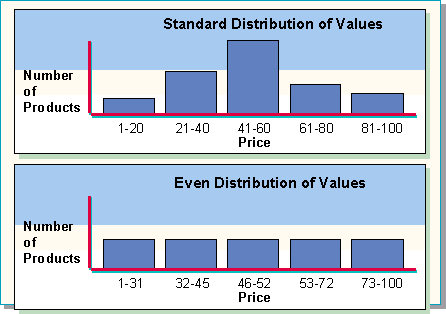
Statistics are used by the optimizer to estimate how useful an index is in limiting a search or in deciding the join order for multiple table queries. Statistics are kept on every index to provide information about the distribution of values in a given index.
In SQL Server, an even distribution of values is maintained for the index statistics. The number of rows per step remains constant while the key value ranges change. (In a standard distribution, the key value ranges remain constant while the number per range changes.) An even distribution allows the query optimizer to easily determine the selectivity of a query by estimating the number of qualifying rows as a percentage of the total rows in the table.
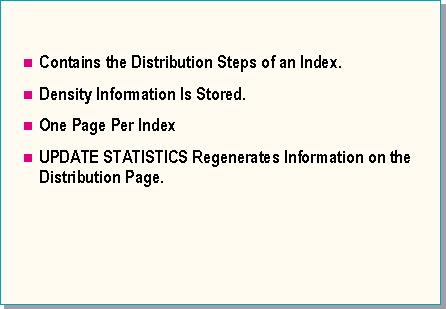
The distribution page represents a sampling of the values contained in the index.
To determine whether a distribution page has been created for an index, query the distribution column in the sysindexes table. A zero in the distribution column indicates that no statistics are available for that index. Otherwise, the number indicates the location of the distribution page.
Executing UPDATE STATISTICS creates a distribution page for each index on a table.
The density refers to the average number of duplicates. A separate value is maintained for each left-based subset of columns in a composite index.
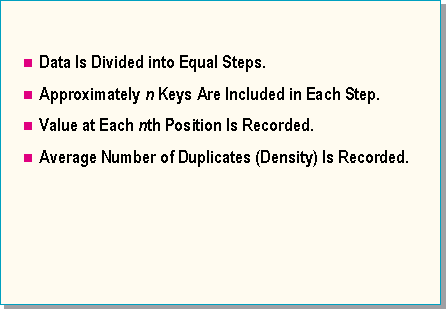
The size of the index key determines the total number of distribution steps for each index. A limit is imposed by the number of values that can fit on the distribution page. The first and last key values in the index are always included.
Note Because the first index key is always included on the distribution page, subtract one from the number of index keys per page to get the total number of distribution steps.
The total number of distribution steps is then divided into the total number of index keys to determine the number of keys to be included in each step. One index key at each step is recorded on the distribution page. SQL Server calculates the size of the step.
The number of index keys per page minus 1 equals the number of distribution steps. The greater the number of steps, the more accurate the information is. Indexes with smaller keys have more accurate statistics. If the number of steps equals the total number of rows, you have complete information.
For composite indexes, only the keys in the first column are used to determine the distribution steps.
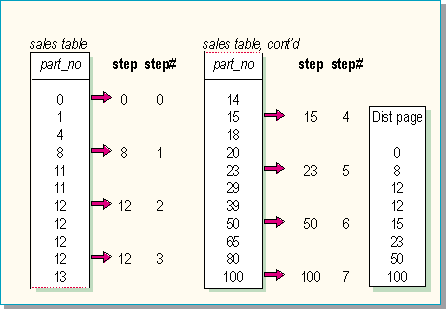
Calculating the number of distribution steps
Index key size = 250 bytes

8 index keys per page minus 1 = 7 distribution steps
Total number of index keys = 22

There are a total of 7 steps, with 3 keys per step.
One seventh of the table is in each step.
One index key at each step (every third row) is placed on the distribution page.
Class example
Index key size = 18 bytes
How many index keys per page?__________________________________
How many distribution steps?_____________________________________
Total number of index keys = 94,795
How many keys per step?________________________________________
How much of the table is in each step?______________________________
Syntax
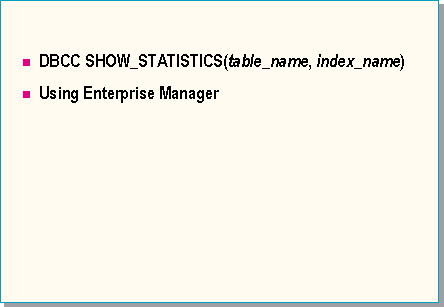
DBCC SHOW_STATISTICS (table_name, index_name)
Displays all the statistical information in the distribution page for an index (index_name) on a specified table (table_name). The results returned indicate the selectivity of an index (the lower the density returned, the higher the selectivity) and provide the basis for determining whether or not an index would be useful to the optimizer.
Enterprise manager
Using SQL Enterprise Manager, on the Manage menu you can click Indexes, or drill down to the name of a table, right-click the name, and then click Indexes. In either case, you will get a dialog box that enables you to examine any index on any table in the database.
Click the Distribution button and you will see much of the same information that DBCC SHOW_STATISTICS provides.
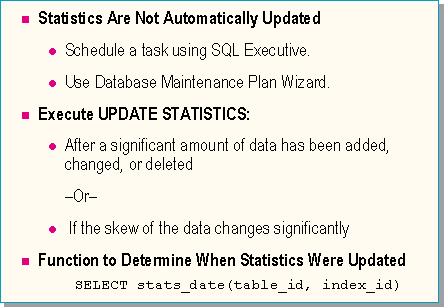
UPDATE STATISTICS [[database.]owner.]table_name [index_name]
The table_name parameter specifies the table with which the index is associated. It is required because SQL Server does not require index names to be unique in a database.
The index_name parameter specifies the index to be updated. If an index name is not specified, the distribution statistics for all indexes in the specified table are updated. To see a list of index names and descriptions, execute the sp_helpindex system stored procedure with the table name.
Syntax
STATS_DATE (table_id, index_id)
This function returns the date that the statistics for the specified index (index_id) were last updated.
Example
To see the date on which the statistics were updated for all indexes on a table, use the following statement:
SELECT 'Index Name' = i.name, 'Statistics Updated' =
	stats_date(i.id, i.indid)
FROM sysobjects o, sysindexes i
WHERE o.name = 'charge' AND o.id = i.id
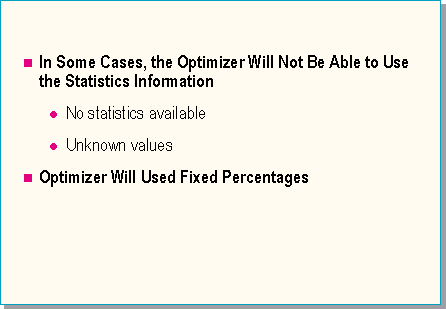
There are some cases in which statistics are not used. This happens when statistics are not available or there is an unknown value in a WHERE clause. Statistics will be unavailable if the index was created before any data was put into the table and UPDATE STATISTICS has not been run, or if the table has been truncated.
Unknown value
Example
DECLARE @var int
SELECT @var = 15
SELECT X FROM Y WHERE col = @var
Because the WHERE clause contains an unknown value, the key values in the index statistics cannot be used. However, if the operator is =, SQL Server will use the density information to estimate the number of qualifying rows.
The fixed percentages are slightly different from the default numbers used if there are no statistics.
| Operator | Assumed Percentag be of Rows |
| = | Determined by density |
| <, >, BETWEEN | 33% |
Note Just because statistics are available does not mean they are up to date.
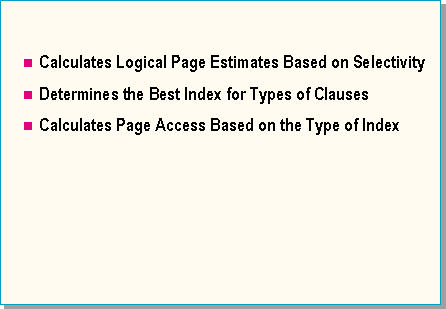
As a second part of determining the selectivity of a clause, the query optimizer calculates the logical page estimates based on row estimates. This determines the best index to select for a particular clause. There can be a big difference between the page estimates for a clustered index and a nonclustered index. With a nonclustered index, the query optimizer assumes the worst-case scenario: that each row will be found on a different page. This factors into the cost-based optimization calculation of the query optimizer.
For no index
Logical page accesses = total number of data pages in table.
For a clustered index
Logical page accesses = number of levels in index plus the number of data pages to scan (data pages = number of qualifying rows / rows per data page).
For a nonclustered index
Logical page accesses = number of levels in index plus the number of leaf pages (qualifying rows / rows per leaf page) plus the number of qualifying rows. (This assumes each row is on a separate page.)
For a covering index
Logical page accesses = number of levels in the index plus the number of leaf pages (qualifying rows / rows per leaf page).
For a unique index
If the query is searching for an equality on all parts of the key of a unique index, logical page accesses = 1 plus the number of index levels.
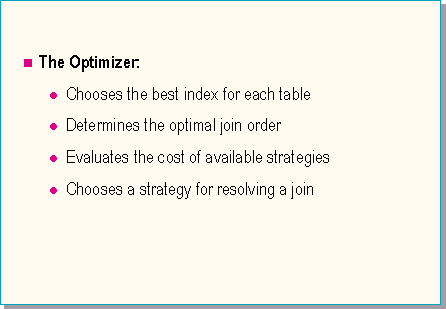
Join selection is the third major step in the query optimization phase. If there is a multiple table query or self-join, the optimizer will evaluate join selection. The optimizer compares how the clauses are ordered and selects the join plan with the lowest estimated processing costs in terms of logical page I/O.
Join selectivity determines how many rows from table A will join with a single row from table B. This is different from determining how many rows match a search argument. Join selectivity is a useful element in determining the order in which joins will be processed.
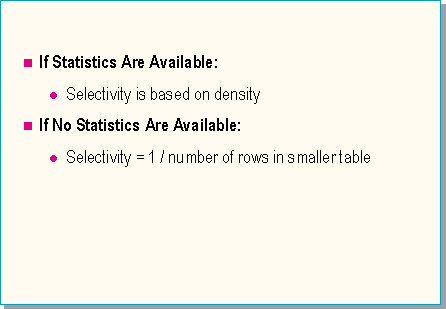
If statistics are available, join selectivity is based on the density of the index. If statistics are not available, the heuristic is 1 divided by the number of rows in the smaller table.
Join selectivity refers to the number of rows expected from a join clause. This can be calculated or based on density (average percentage of duplicate rows).
Join clause example
WHERE dept.deptno = empl.deptno
Assumptions:
1,000 employees
100 departments
Intuitively one would estimate that there are 10 employees per department. Because the query optimizer lacks intuition, it must calculate the selectivity through other means.
The selectivity for the above clause is 1 / 100 or .01.
Given a row in the department table, the number of rows in the employee table that join it is: 1,000 * .01 = 10
Given a row in the employee table, the number of rows in the department table that join it is: 100 * .01 = 1
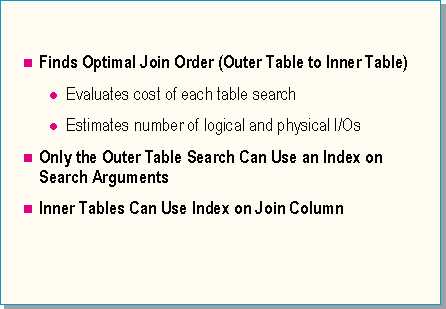
If there is a join clause in the query, the optimizer evaluates the number of tables, indexes, and joins to determine the optimal order for the nested iteration.
Strategy
Guidelines

The optimizer may choose to do a nested iteration of joins. If this strategy is chosen, SQL Server constructs a set of nested loops by finding a row from the first table and then using that row to scan the next table, and so on until the result that matches is used to scan the last table. The results set is narrowed down as it progresses from table to table with each iteration.
The query plan specifies the ordered set of nested tables to use. The number of different possible plans is related to the number of tables, indexes, and joins.
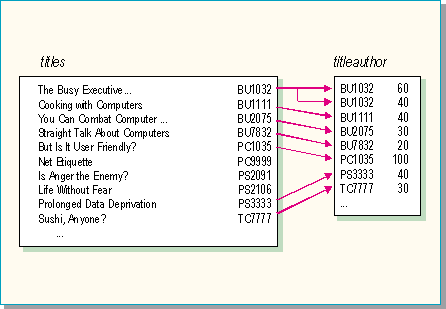
Example
SELECT title
FROM titles, titleauthor
WHERE titles.title_id = titleauthor.title_id
AND titleauthor.royaltyper > 50
Processing steps
Using index on title_id, locate each matching row in titleauthor.
Compare value of royaltyper, and return row if it’s > 50.
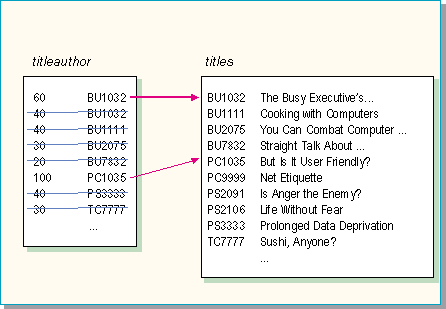
Example
SELECT title
FROM titles, titleauthor
WHERE titles.title_id = titleauthor.title_id
AND titleauthor.royaltyper > 50
Processing steps
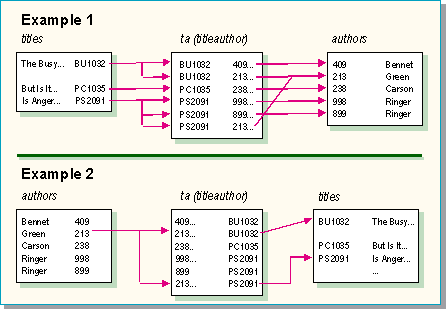
Example
SELECT t.title, a.au_lname
FROM titles t, authors a, titleauthor ta
WHERE t.title_id = ta.title_id
	AND a.au_id = ta.au_id
	AND a.au_lname = 'Green'
Example 1
titles to ta (titleauthor) to authors (shown above)
Because there are three titles, search titleauthor three times and search authors six times.
Example 2
authors to ta (titleauthor) to titles (shown above)
Because there is only one author = Green, search titleauthor one time and search titles two times.
The difference in these examples is that authors is searched six times in the first case and only one time in the second case.
Key points
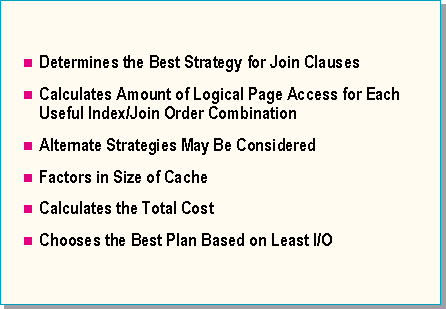
It calculates the costs for each join order.
The query optimizer recognizes that if the index is unique and the WHERE clause equals a specific value, the cost is always one page access plus the number of levels in the index.
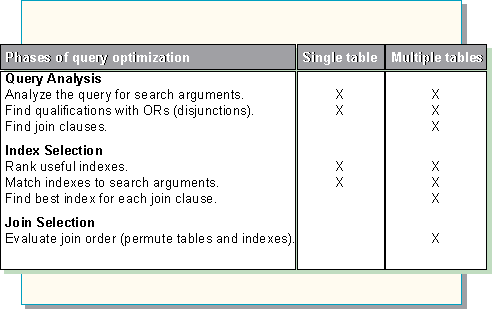
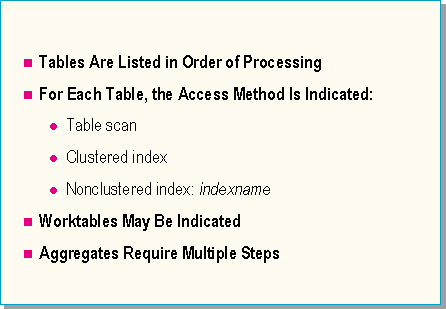
The output from the SHOWPLAN parameter of the SET statement details the final access method that the query optimizer chooses for processing a query. Below is an explanation of the output messages.
STEP n
This statement is included in the SHOWPLAN output for every query. In some cases, SQL Server cannot effectively retrieve the results in a single step, so it breaks the query plan down into several steps.
The type of query is <query type>
This statement describes the type of query (SELECT, INSERT, UPDATE, or DELETE) used in each step. If SHOWPLAN is turned on while other commands are issued, <query type> reflects the issued command.
The update mode is deferred
This statement indicates that the update mode that was selected is deferred.
The update mode is direct
This statement indicates that the update mode that was selected is direct.
GROUP BY
This appears in the SHOWPLAN output for any query that contains a GROUP BY clause. A GROUP BY always requires at least two steps: one step to select the qualifying rows into a worktable and group them, and another step to return the results.
Scalar aggregate
This indicates that an aggregate function was used in the SELECT statement. Because a single value is returned, regardless of the number of rows involved, the first step calculates the aggregate and the second step returns the final value.
Vector aggregate
If a GROUP BY clause is used in conjunction with an aggregate function, the query optimizer uses a vector aggregate. A single value is returned for each group.
FROM TABLE
This statement indicates the name of the table that the query is accessing. The order of the tables listed after FROM TABLE indicates the order in which the tables were joined together to process the query.
TO TABLE
This indicates the target table that is being modified. In some cases, the table is a worktable rather than a physical table in the database.
Worktable
This indicates that a temporary table was created to hold the intermediate results of a query. This occurs when rows need to be sorted. Worktables are always created in the tempdb database and are automatically dropped after the results are returned.
Worktable created for <query type>
This indicates that a worktable was created to process a query. The query type could be: SELECT_INTO, DISTINCT, or ORDER BY, or the worktable could be created for the purposes of REFORMATTING.
This step involves sorting
This indicates that the intermediate results of the query must be sorted before they are returned to the user. This happens when there is no useful index for queries that either specify DISTINCT or that include an ORDER BY.
Using GETSORTED
This indicates that SQL Server has created a temporary worktable to sort the rows in the results set. Note that not all queries that return rows in sorted order use this step.
Nested iteration
Nested iteration is the default technique of the optimizer, and this phrase occurs in all SHOWPLAN output.
EXISTS TABLE: nested iteration
This statement indicates a nested iteration on a table that is used as part of an existence test. In Transact-SQL, an existence test can be written as EXISTS, IN, or =ANY.
Table scan
This indicates that the query optimizer has selected the table scan strategy to retrieve the results.
Using clustered index
This indicates that the query optimizer is using the clustered index to retrieve the results set.
Index: <index name>
This indicates the name of the nonclustered index that the query optimizer is using to retrieve the results set.
Using dynamic index
This indicates that the optimizer has chosen to build its own index as part of the OR processing strategy.
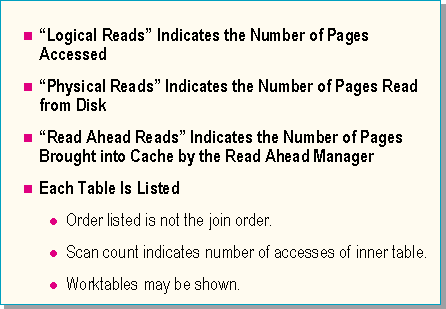
The output from STATISTICS IO includes the following values:
This value indicates the total number of pages that were accessed to process this query. All page accesses are done through the data cache, so if a page is not already available in cache, it must be read in.
This value indicates the number of pages that were read in from disk. It will always be less than or equal to the value of Logical Reads.
The value of Cache Hit Ratio can be computed from the above two values as follows:
Cache Hit Ratio = (Logical Reads – Physical Reads) / Logical Reads
This value indicates the number of pages that were read into cache by the Read Ahead Manager. A high number for this value will mean that the value for Physical Reads is lower, and the Cache Hit Ratio is higher than if read ahead was not enabled.
This value indicates the number of times that the corresponding table was accessed. Outer tables should always have a scan count of 1. For inner tables, the number of Logical Reads will be determined by the Scan Count times the number of pages accessed on each scan.
Objectives
In most cases the optimizer chooses the best indexes and the best join order for the queries it processes.
If you suspect that the optimizer may not have made the best choice, there are tools available to analyze why the optimizer made the choices it made. Sometimes just knowing the reasons is enough to persuade you that the right choice was made.
In other situations, you may still not be convinced. There are also tools available to override the optimizer. You can use these tools to determine if your choice really is better than the optimizer’s choice.
Statistics management tools
DBCC UPDATEUSAGE
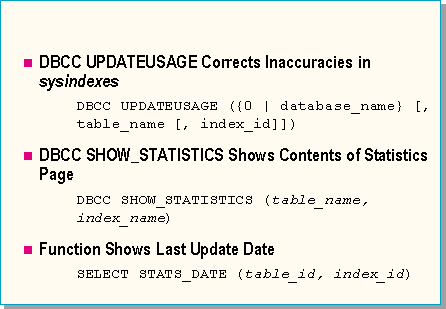
This command reports and corrects inaccuracies in the sysindexes table that can result in incorrect space usage reports by the sp_spaceused system stored procedure.
This statement corrects the used, reserved, and dpages columns of the sysindexes table for any clustered indexes on objects of the type U (user-defined table) or S (system table). Size information is not maintained for nonclustered indexes. This statement can be used to synchronize space usage counters in sysindexes, which will result in accurate usage information being returned. When you use 0 instead of the database_name, the update is performed in the current database.
Syntax
DBCC UPDATEUSAGE ({0 | database_name} [, table_name [, index_id]])
[WITH COUNT_ROWS]
The WITH COUNT_ROWS option specifies that the rows column of sysindexes is updated with the current count of the number of rows in the table. This only applies to sysindexes rows that have an index_id of 0 or 1. This option can affect performance on large tables.
Note The stored procedure sp_spaceused can be used with the @updateusage qualifier to provide the same functionality as DBCC UPDATEUSAGE. The sp_spaceused stored procedure takes longer to execute. Using this option on large tables may take longer to complete because every row in the table is counted.
DBCC SHOW_STATISTICS
This command displays all the statistical information in the distribution page for an index on a specified table. The results returned indicate the selectivity of an index (the lower the density returned, the higher the selectivity) and provide the basis for determining whether or not an index would be useful to the optimizer. The results returned are based on distribution steps of the index.
Syntax
DBCC SHOW_STATISTICS (table_name, index_name)
STATS_DATE function
This function returns the date that the statistics for the specified index were last updated.
Syntax
STATS_DATE (table_id, index_id)
All of the above information is available in Enterprise Manager, using the Manage Indexes dialog box. (On the Manage menu, click Indexes.)
Trace flags
Trace flags
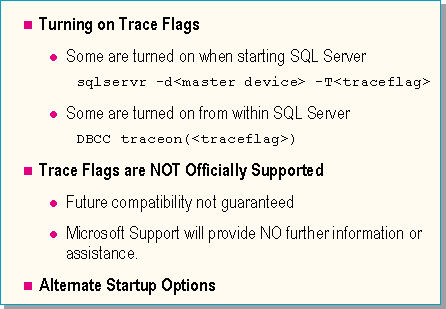
SQL Server trace flags provide additional information about SQL Server operations or change certain behaviors, usually for backward compatibility. In general, trace flags should only be used as a temporary work-around for a problem until a permanent solution is put in place. Although the information provided by trace flags can help diagnose problems, keep in mind that trace flags are not part of the supported feature set. This means that future compatibility or continued use is not assured. In addition, your primary support provider, including Microsoft, will usually not have further information and will not answer questions regarding the trace flags or their output. In other words, the information provided in this section is to be used at your own risk.
Optimizer trace flags
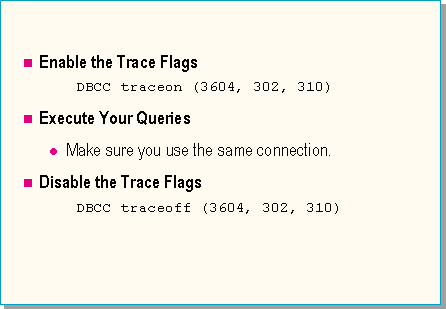
| Trace flag | Information |
| 302 | Gives information about whether the statistics page is used, the actual selectivity (if available), and what SQL Server estimated the physical and logical I/O would be for the indexes. Trace flag 302 should be used with trace flag 310 to show the actual join ordering. |
| 310 | Gives information about join order. Index selection information is also available in a more readable format using SET SHOWPLAN ON, as described in the SET statement. |
| 325 | Gives information about the cost of using a nonclustered index or a sort to process an ORDER BY clause. |
| 326 | Gives information about the estimated and actual cost of sorts. |
| 330 | Enables full output when using the SET SHOWPLAN option, which gives detailed information about joins. |
| 3604 | Sends trace output to the client. This trace flag is used only when setting trace flags with DBCC TRACEON and DBCC TRACEOFF. |
| 3605 | Sends trace output to the error log. (If SQL Server is started from a command prompt, the output will also appear on the screen.) |
Alternate startup options
When SQL Server is installed, the setup program writes a set of default startup options in the Windows NT Registry under the key:
HKEY_LOCAL_MACHINE
	\SOFTWARE
		\Microsoft
			\MSSQLServer
				\MSSQLServer
If you want to create and store alternate sets of startup options in the Registry-for example, to start SQL Server in single-user mode or with a specific set of trace flags-copy the MSSQLServer key (under MSSQLServer) to a new key, and then edit the options in the new key to suit your needs. Each startup option, including each trace flag, is stored as a separate parameter in the Parameters entry of the MSSQLServer key, starting with SQLArg0, then SQLArg1, and so on. The order of the parameters is not important.
Editing of the Registry is not generally recommended, and inappropriate or incorrect changes can cause serious configuration problems for your system.
You could create a new key called SingleUser, and then edit this entry
HKEY_LOCAL_MACHINE
	\SOFTWARE
		\Microsoft
			\MSSQLServer
				\SingleUser
					\Parameters
to include the additional -m startup option. The entire Parameters entry for the SingleUser key would look like this:
HKEY_LOCAL_MACHINE
	\Software
		\Microsoft
			\MSSQLServer
				\SingleUser
					\Parameters
SQLArg0 : REG_SZ : -dC:\SQL\DAT\MASTER.DAT
SQLArg1 : REG_SZ : -eC:\SQL\LOG\ERRORLOG
SQLArg2 : REG_SZ : -m
To start SQL Server using this alternate key, you would start SQL Server from the command prompt using the –s startup option, as shown in the following example:
sqlservr -c -sSingleUser
Using optimizer trace flags
The optimizer trace flags provide a lot of information, most of it intended for Microsoft engineers. There are a few specific things you can look for:
Example
Here is some Transact-SQL code and its output. The output that answers the questions above is in bold type.
DBCC TRACEON(3604, 302)
SET SHOWPLAN ON
SET NOEXEC ON
GO
SELECT * FROM charge
WHERE charge_no > 99950
DBCC execution completed. If DBCC printed error messages, see your System Administrator.

*******************************
Leaving q_init_sclause() for table 'charge' (varno 0).

The table has 100000 rows and 3408 pages.

Cheapest index is index 0, costing 3408 pages per scan.

*******************************
Entering q_score_index() for table 'charge' (varno 0).
The table has 100000 rows and 3408 pages.
Scoring the search clause:
AND (!:0xb8e492)  (andstat:0xa)
  GT (L:0xb8e47e)  (rsltype:0x38 rsllen:4 rslprec:10 rslscale:0
  opstat:0x0)
    VAR (L:0xb8e4d0)  (varname:charge_no varno:0 colid:1
    coltype(0x38):INT4 colen:4 coloff:2 colprec:10 colscale:0
    vartypeid:101 varusecnt:2 varstat:0x4001 varlevel:0 varsubq:0)
    INT4 (R:0xb8e464)  (left:0xb8e46c len:4 maxlen:4 prec:5 scale:0
    value:99950)

Scoring clause for index 6
Relop bits are: 0x4000,0x80,0x10,0x1

Qualifying stat page; pgno: 10616 steps: 332
Search value: INT4 value:99950
No steps for search value--qualpage for LT search value finds
value between steps 330 and 331--use betweenSC

Estimate: indid 6, selectivity 4.513098e-003, rows 451 pages 457
Cheapest index is index 6, costing 457 pages and generating 451 rows
per scan.
Search argument selectivity is 0.004513.
*******************************
STEP 1
The type of query is SELECT
FROM TABLE
charge
Nested iteration
Index : charge_charge_amt
FORCEPLAN
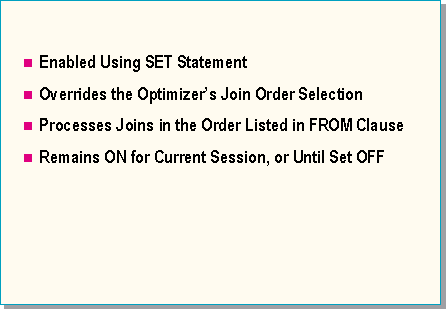
FORCEPLAN is an option of the SET statement, and it can be either ON or OFF. Once FORCEPLAN is turned ON, it stays in effect for the session, or until set to OFF.
When FORCEPLAN is ON, the order in which tables are listed in the FROM clause controls the order in which the tables will actually be joined; the optimizer will bypass making any decisions about join order.
Using FORCEPLAN

Example
In this example, the query will be processed by accessing the corporation table first, and then the member table, no matter what the optimizer might have chosen as the best order.
SET FORCEPLAN ON
GO
SELECT *
FROM corporation, member
WHERE member.corp_no = corporation.corp_no
AND member_no < 100
GO
Forcing an index
Optimizer indexing hints
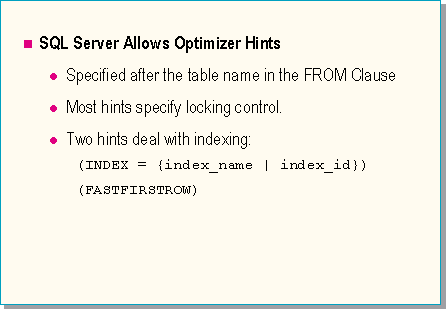
SQL Server provides a number of hints that can be supplied to the optimizer within a SELECT statement. Most of these will be discussed in a later module, because they apply to locking behavior. One hint that deals with indexing is the INDEX hint. You must supply an index ID or an index name after the name of the table in the SELECT statement:
Partial syntax
SELECT select_list
FROM table_name [(INDEX = {index_name | index_id})]
The hint specifies the index name or ID to use for the table. An index_id of 0 forces a table scan, and 1 forces the use of a clustered index (if one exists).
Example
In this example, the query will be processed by using the index on corp_no, no matter what the optimizer might have chosen as the best index.
SELECT *
FROM member (INDEX = member_corporation_link)
WHERE member_no < 100
AND corp_no BETWEEN 200 AND 300
FASTFIRSTROW
This option causes the optimizer to use a nonclustered index if it matches the ORDER BY clause and there is no WHERE clause. The first row will be returned more quickly and a work table for sorting will not be built in tempdb; read-ahead will not be used, and the total amount of I/O and the time required to complete the query may be greater. If the query contains a WHERE clause as well as an ORDER BY clause, then SQL Server may use an index that resolves the WHERE clause instead of the index that resolves the ORDER BY clause. The decision will be based on the selectivity of the WHERE clause, but it will be influenced by the presence of FASTFIRSTROW.
Additional Considerations
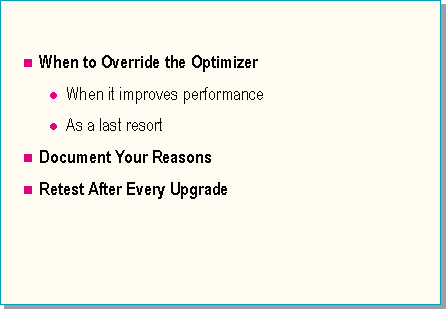
When it improves performance
Be sure to verify that performance has been improved. Turn on STATISTICS IO and STATISTICS TIME to determine that overriding the optimizer has had a positive impact. Usually the optimizer really does know best, and overriding the optimizer does not make performance better.
As a last resort
Try other methods of getting the optimizer to behave as you would like it to behave. Have you updated statistics recently? Have stored procedures been recompiled lately? Can you rewrite your query or search arguments? Can you build slightly different indexes?
Document your reasons for hinting
Make sure to leave a record of why you needed to override the optimizer. If those reasons change long after you originally wrote the code, you may not realize that your hints are no longer necessary.
Retest after every upgrade
The SQL Server optimizer is continually being improved. After installing a new version, it may no longer be necessary to override the optimizer. Your suggestions may actually be worse than the optimizer’s own choices.
The SQL Server optimizer is dynamic and can find a new best plan as your data changes. If you have to force the optimizer, that decision becomes non-dynamic. As your data changes, your plan will stay the same. For this reason, you should consider retesting on a regular basis any query for which you chose to override the optimizer, even if the version of SQL Server has not been upgraded.