Presented by: Adam Shapiro

Microsoft® SQL Server™ provides many options to configure a SQL Server and affect its behavior. The most important ones will be covered in this module.
With the exception of a small handful of options that should be adjusted to conform to your hardware environment, most of the options never need to be adjusted.
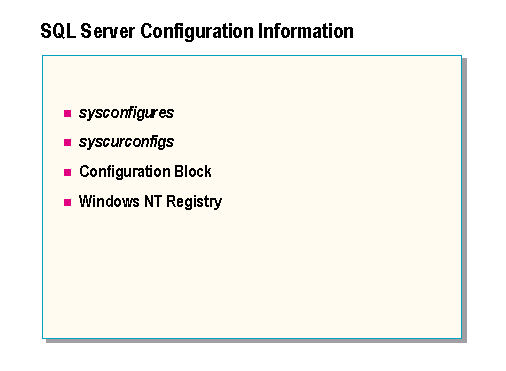
System configuration information is stored in the following four places:
sysconfigures
This system table contains one row for each configuration option that can be set by a user. It contains the configuration options that were defined before the latest SQL Server startup, plus any dynamic configuration options that were set since the latest SQL Server startup.
syscurconfigs
This system table contains an entry for each of the configuration options, as does sysconfigures, but syscurconfigs contains the current values. In addition, it contains four entries that describe the configuration structure.
Although this is listed as a table in sysobjects, it is actually is a pseudo table that is built only when a user queries it. If you look at the sysindexes row for syscurconfigs, you will see that it does not have any data rows.
The configuration values can be changed by using SQL Enterprise Manager or by executing the sp_configure system stored procedure. If you execute sp_configure to change a configuration option, you must follow it with the RECONFIGURE statement. SQL Enterprise Manager automatically executes the RECONFIGURE statement.
Configuration block
The RECONFIGURE statement installs a changed configuration option. This means that the contents of the syscurconfigs table are written to the first four pages of the MASTER device. These pages are called the configuration block. From the MASTER device, the values can be read into the sysconfigures table the next time SQL Server is started.
Windows NT registry
When SQL Server is started, it reads the configuration block from the MASTER device. The location of the MASTER device can be found in the Microsoft Windows NT® Registry.
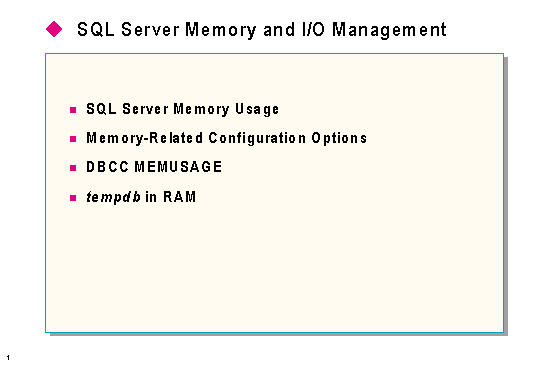
The amount of memory allocated to SQL Server is probably the single most important configuration adjustment you can make.
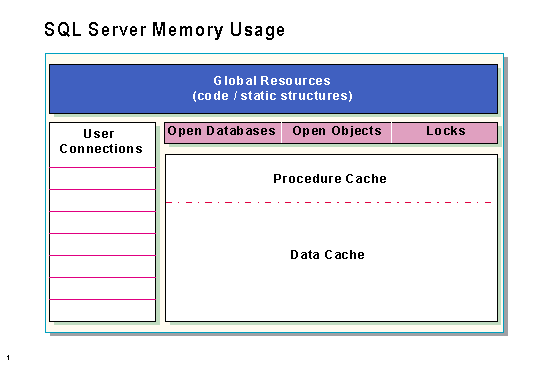
Global resources
Global resources are those that are used by all processes and databases. The global resource area is mostly pointers to other structures such as structures that control each database defined on the server; hash tables for pages, extents, and procedures; information on server-wide character set and sort order, and so on. This area also includes the executable code for SQL Server.
User connections
Each user connection requires about 27K of SQL Server memory for the server structures and another 3K for ODS structures, for a total of 30K. This memory is used for the process status structure (PSS), transaction descriptors, session descriptors, protection cache, login record, and parser work area, all of which are allocated from the heap created by SQL Server at initialization time.
In addition, a 1-MB global stack is reserved for user connections, but this memory is not immediately committed. If more stack space is needed while SQL Server is running, more memory is committed up to the 1-MB limit. Each new thread (that is, a user connection actually being used) requires about 20K from the stack.
So each user connection requires a total of 50K up to the max worker threads limit; after that, each connection requires 30K.
Locks, open databases, and open objects
Memory is allocated for locks, open databases, and open objects, based on the configuration value for each. The following values can be used to estimate the total memory consumption for these options:
| Lock | 60 bytes |
| Open database | 162 bytes |
| Open object | 240 bytes |
To see more information about actual memory usage for a system, turn on trace flag 3635 before executing DBCC MEMUSAGE.
Procedure and data cache
Procedure and data cache will be discussed in detail later in this module.

Memory
This configuration option sets the size of available memory in 2K units. The initial value is determined by the setup program based on the amount of memory in the computer.
To optimize this number for a system, subtract the memory required for Windows NT (and other system uses if the computer is not wholly dedicated to SQL Server) from the total physical memory.
Ideally, it is good to allocate as much memory as possible to SQL Server without causing the system to page. The Windows NT Performance Monitor can be used to help determine what the threshold is for a system. The Page Faults/sec counter of the Memory object indicates whether any page faults are being generated. If so, SQL Server is running with too much memory. The threshold varies depending on the system.
The table below provides suggestions for appropriate starting values for SQL Server memory allocation. These values are intended for use on a machine dedicated to SQL Server.
|
RAM (MB) |
SQL Server memory allocation (in MB) | SQL Server memory allocation (in 2K units) |
| 16 | 4 | 2,048 |
| 24 | 8 | 4,096 |
| 32 | 16 | 8,192 |
| 64 | 40 | 20,480 |
| 128 | 100 | 51,210 |
| 256 | 216 | 110,592 |
| 512 | 464 | 237,568 |
This value should be changed only when memory is added or removed from a system, or when the use of the system changes.
When the memory option is reconfigured, it will automatically cause a change to the free buffers configuration option. The free buffers configuration value will be set to 5% of the new memory size. The meaning of this value will be discussed later.
The maximum value for the memory option is 2 GB. Note, however, that the memory option does not include memory needs for tempdb if you have placed tempdb in RAM using the tempdb in RAM option.
Open databases
This configuration option sets the maximum number of databases that can be open at one time on SQL Server. The default is 20. Because open databases use memory, increasing this value can make it necessary to increase the amount of memory dedicated to SQL Server.
Open objects
This configuration option sets the maximum number of database objects that can be open at one time on SQL Server. The default is 500.
Increase this value if SQL Server displays a message saying that you have exceeded the number of open objects. Because open objects use memory, increasing this value can make it necessary to increase the amount of memory dedicated to SQL Server.
User connections
This configuration option sets the maximum allowable number of simultaneous connections to SQL Server. The actual number of possible connections might be less than this value, depending on your database environment.
The number of user connections allowed depends on the version. For SQL Workstation, the number is 15, and for SQL Server, the number is 32,767. However, the actual number is based on practical limits that vary depending on your application and hardware.
Use this statement to get a report on the maximum number of user connections that your system can use:
SELECT @@max_connections
There is no formula for determining how many connections to allow for each user. This number should be set based on system and user requirements. Users executing DB-Library or ODBC applications may open multiple connections in one application. On a system with many users, there is more likelihood that connections needed only occasionally can be shared among users.
Locks
This configuration option sets the number of available locks. Locks are not shared the way open databases and database objects are shared. The default is 5,000.
Increase this value if SQL Server displays a message saying that you have exceeded the number of available locks. Since each lock consumes memory (32 bytes per lock), increasing this value can make it necessary to increase the amount of memory dedicated to SQL Server.
Procedure cache
This configuration option specifies the percentage of memory allocated to the procedure cache after the memory needs for SQL Server are met. SQL Server memory needs are the sum of memory necessary for locks, open databases, open objects, user connections, the code itself, and global resources. The remaining memory is divided between the procedure cache and the data cache, according to the percentage set by this configuration option.
The procedure cache is the area of memory where the most recently used procedures are stored. The procedure cache is also used when a procedure is being created and when a query is being compiled. The default for the procedure cache configuration option is 30, which gives the procedure cache 30% of the remaining memory after the SQL Server requirements are met. The data cache gets the other 70%.
Since the optimum value for this configuration option is different from application to application, resetting it can improve SQL Server performance. For example, if you run many different procedures or ad hoc queries, your application will use the procedure cache more, so you might want to increase this value. Many applications fall into this category while they are being developed.
If more memory is added to improve the data cache hit ratio, the procedure cache percentage can be reduced to keep the size of procedure cache relatively constant.
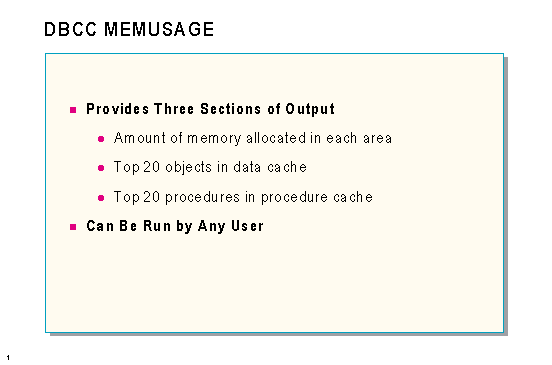
DBCC MEMUSAGE
The MEMUSAGE option on the DBCC statement provides detailed reports on memory use. It reports three different types of information:
If multiple copies of an object are in the procedure cache, DBCC MEMUSAGE sums the total memory used by them. Of the multiple copies, some may be precompiled versions of the object (trees) and some may be compiled versions (plans). DBCC MEMUSAGE shows the sizes of both the trees and plans, and it shows the total number of trees and plans in the cache.
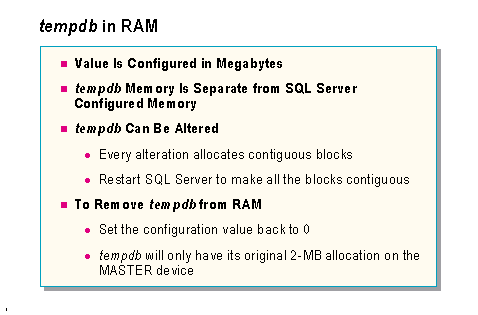
The tempdb database is used for work space in sorting and for creating temporary tables in some join operations. It is also used when programmers create explicit temporary tables or temporary stored procedures.
The tempdb in RAM configuration option allows tempdb to be made entirely memory resident. In some specific situations, this can provide a performance advantage. However, if tempdb in RAM is used inappropriately, it can consume memory that would otherwise be used for the SQL Server data cache, and this can hurt performance.
In most cases, the available RAM is best used as a data cache, rather than as the location of tempdb. Data in tempdb will itself be cached using SQL Server data cache least recently used (LRU) algorithm.
Use of tempdb in RAM can accelerate tempdb operations, but will deplete memory available for the SQL Server data cache, which can lower the cache hit ratio. Memory used for tempdb in RAM is allocated separately from the pool set by the memory option, and the server must be configured appropriately.
For example, if you use 100 MB for tempdb in RAM, the memory setting may need to be reduced by 100 MB to free up memory for this. By contrast, giving all available memory to SQL Server, as opposed to setting some aside for tempdb in RAM, can increase the cache hit ratio. SQL Server will cache all disk I/O operations, including those involving tempdb.
The limited amount of RAM available on many machines will constrain the allowable size of tempdb when placed in RAM. If unforeseen growth requirements for tempdb materialize, this could be a problem. If this is a concern, do not place tempdb in RAM.
Using available RAM for the SQL Server data cache is usually better than using a large chunk of it for tempdb in RAM. However, using tempdb in RAM might be beneficial if all of the following conditions are true:
If the decision is made to put tempdb in RAM, it is best to objectively verify the performance benefit obtained from this. To do this:
If the amount of improvement is not worthwhile, it is probably best to give the RAM back to the SQL Server data cache.
Putting tempdb in RAM is safe and will not harm database integrity or recoverability. This is because tempdb is only used for intermediate operations and is completely rebuilt on each server restart.
The tempdb in RAM option is an important performance tool that is available for cases where analysis shows it to be beneficial. In some cases, it can provide a significant performance improvement, but it should not be used indiscriminately.
Altering tempdb in RAM
The tempdb database can be expanded, including tempdb in RAM. However, when tempdb resides in RAM, it can only be altered 10 times without requiring the server to be shut down and restarted. Altering tempdb while it is in RAM causes each alteration of the database to allocate a new “chunk” of contiguous memory to tempdb. This memory, although it is contiguous, is not necessarily located next to the existing portion(s) of tempdb in RAM. To obtain maximum performance, the server should be stopped and restarted after tempdb is altered.
Removing tempdb from RAM
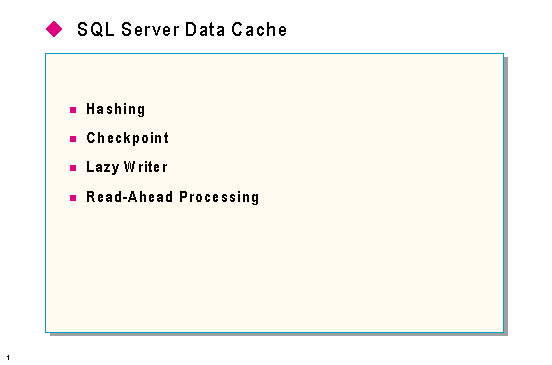
Data cache is a set of buffers (or page frames) used to hold pages that have been read in from disk. It is contained in the memory allocated to SQL Server. It is also called page cache or buffer cache.
The amount of memory allocated to SQL Server is probably the single most important configuration adjustment you can make. This is because the amount of data cache is directly proportional to the amount of allocated memory. Whether a page is in data cache determines whether accessing it produces a physical read or not, and physical reads (from disk) are one of the most expensive operations SQL Server can perform.
Some of the terms that will be used in this section include:
Dirty page
A data page that has been changed by data modification statements and has not yet been written to disk.
Free page
A page that is not being used by any process and is not dirty.
Least recently used/most recently used (LRU/MRU) chain
A linked list of pages ordered from least recently used to most recently used.
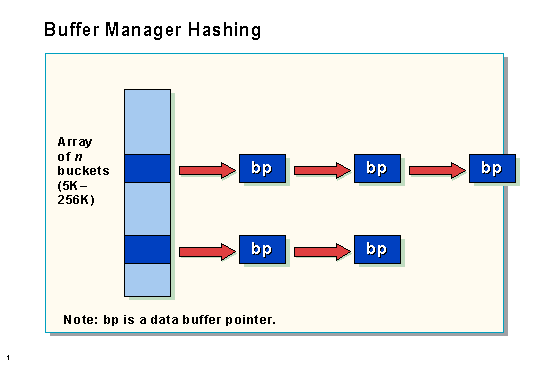
Pages in data cache are hashed to allow SQL Server to find them quickly or to determine that they are not in cache. The hash buckets configuration option sets the number of “buckets” that will be used for hashing pages to data cache buffers in memory. More hash buckets allow SQL Server to find a referenced page faster, because they hash very close to the referenced page in the used page list and then traverse the chain until it finds the right page.
The goal is to limit the size of the chain for any particular hash bucket. The more buckets, the shorter the chains. Even a very large data cache can be searched quickly using only a modest number of hash buckets.
Example
The default number of hash buckets is about 8K. If each hash bucket is the optimal length (four pages), SQL Server can support a data cache size of:
4 x 8K = 32K pages = 64 MB
Using the maximum number of hash buckets (256K) and the optimal hash chain length, SQL Server can support a data cache size of:
4 x 256K = 1024K pages = 2 GB
If the chains are all less than four pages in length, the configuration is optimal. If the chain length is larger, increase the value of the hash buckets configuration option.
These hash buckets consume very little memory, and SQL Server adjusts the actual number of hash buckets to a prime number closest to the entered value. The default value is 7,993 hash buckets, and the maximum value is 265,003 hash buckets.
DBCC BUFCOUNT can be used to inspect how effective the current hashing configuration is.
DBCC TRACEON(3604)
GO
DBCC BUFCOUNT
GO
**** THE 10 LONGEST BUFFER CHAINS ****
	bucket number = 20       chain size = 2
	bucket number = 276       chain size = 2
	bucket number = 532       chain size = 2
	bucket number = 1044       chain size = 2
	bucket number = 1300       chain size = 2
	bucket number = 1556       chain size = 2
	bucket number = 1812       chain size = 2
	bucket number = 2324       chain size = 2
	bucket number = 3092       chain size = 2
	bucket number = 3604       chain size = 2
	The Smallest Chain Size is: 0
	The Average Chain Size is: 0.671668

The checkpoint system process
The checkpoint process is a system process that is always running on SQL Server, primarily in a sleep state. The sp_who procedure can be run to see it. Once each minute the checkpoint process wakes up and inspects the transaction log of each database. If the checkpoint system process determines that enough work has occurred since the last checkpoint, SQL Server will issue another checkpoint for that database.
Whether or not enough work has been done is determined by the value of the recovery interval configuration option value. It is set in minutes. The checkpoint system process determines if enough transactions are in the log to take the configured number of minutes to recover.
The CHECKPOINT statement
The CHECKPOINT statement can be issued manually by the DBO or SA.
What happens during checkpoint
When SQL Server issues a checkpoint, it writes all dirty pages to the disk. The pages for each database are linked together so that the checkpoint can quickly find the pages for the database being checkpointed.
Once issued (either automatically by SQL Server or manually by using the CHECKPOINT statement), the checkpoint consists of two stages. In the first stage, SQL Server will mark all pages that need to be flushed. If checkpoint logging is enabled (by issuing trace flag 3502), the SQL Server error log will have information similar to the following:
Ckpt dbid 6 started (4000) (checkpoint begins)
Ckpt dbid 6 phase 1 ended (0) (1st phase ends)
Ckpt dbid 6 complete. (2nd phase and the checkpoint ends)
In the second stage, the checkpoint thread flushes all marked pages. This stage lasts much longer than the first stage, depending on the number of pages to be flushed, the speed of the disk subsystem, the saturation level of the server, and other factors. When all dirty pages are flushed from the data cache to the disk, the checkpoint is done.
During the checkpoint, the number of single-page writes (Object: SQLServer, Counter: I/O – Single Page Writes/sec) may increase. This counter is typically zero. During the checkpoint, as new transactions are requesting data pages that have not been flushed by the checkpoint thread, SQL Server flushes these pages on demand. This is a normal activity.

SQL Server supports a system process (visible by executing sp_who) called the lazy writer. This process will automatically start flushing buffers when the number of available free buffers falls below the threshold determined by the configuration option free buffers.
The lazy writer process reduces the need to checkpoint frequently for the purpose of creating available buffers. The batch I/O size used by the lazy writer can be set by the configuration option max lazywrite IO.
Flushing dirty pages

SQL Server will flush pages from the cache to disk under the following conditions:
When SQL Server determines that a page is needed that is not currently in the cache and there are no buffers in the free buffer list, it looks for a free buffer in the cache page chain. When it has finished going through the chain, the page from the oldest buffer is flushed to disk.
If there are no unused buffers available, and no buffers in the free buffer list, the process requesting the page is suspended until a page becomes available.
When the fast bcp (non-logged version) is used, or when a table is created using SELECT INTO, the newly inserted rows are not logged. Also, many or all of them may still be in the cache. To lessen the chance of losing data in the event that SQL Server is stopped without a checkpoint, all dirty pages are flushed to disk when the bcp batch or SELECT INTO finishes.
When a transaction either commits or aborts, the log pages are flushed to disk.
When a page is split, the newly allocated page is immediately flushed to disk.
When a database is being restored with the LOAD DATABASE statement, all pages in the dump are written directly to disk. In addition, any pages in the database that are not part of the backup are also initialized and flushed to disk. For example, if you are loading a backup from a 4-MB database into a 10-MB database, the remaining 6 MB of pages will all be initialized and written to disk.
The lazy writer process automatically starts flushing buffers when the number of available free buffers falls below a certain threshold. If there are no buffers available to be flushed, the lazy writer writes a message to the error log.
Asynchronous I/O
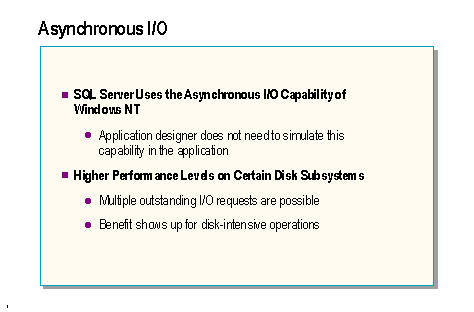
Higher performance levels on certain disk subsystems
To see how the performance effects of asynchronous I/O are different for different types of disk subsystems, consider three different types of disk subsystems. The first is a non-intelligent controller attached to four disk drives. The second is four non-intelligent controllers, each attached to a single disk drive. The third is a single intelligent controller attached to four disk drives.
Single controller and four drives
First, consider how a data transfer occurs with a single controller and four drives. In the outbound transfer sequence, the device driver transfers a buffer of data to the controller’s on-board buffer. This takes place very rapidly using direct memory access (DMA), shared memory, or programmed I/O, typically in a few hundred microseconds at typical bus rates. Then the controller (under varying amounts of device driver assistance) must command the necessary seek operations from the drive. These can take up to 50 milliseconds, which is hundreds of times longer than the bus-to-controller transfer.
Following this, the actual data is transferred from the controller buffer to the disk drive at the transfer rate determined by the drive type. There may also be rotational latency involved prior to starting the transfer. During this interval, in many systems, the device driver and the task that called it must simply wait for the hard disk drive. Operations cannot be performed on the second and subsequent drives until the first drive finishes, because the controller does not have the necessary logic to keep track of multiple pending operations.
Four controllers attached to separate drives
In the case of four controllers (each attached to its own drive), if Windows NT striping is used, a transfer sequence can immediately begin on the second or subsequent controller or drive. In this case, the four drives can independently be in different phases of the transfer, because each has its own controller to keep track of this.
Using Windows NT asynchronous I/O in this hardware configuration can be beneficial, because a pool of outstanding I/Os can be built up, which the drive subsystem can process in parallel, four at a time. Because the rate at which the drive subsystem processes the requests can vary, it may be useful to build up a pool of outstanding requests from SQL Server to ensure that the subsystem is used to capacity. Depending on many system-specific factors, it may be useful to reconfigure SQL Server to allow a greater number of asynchronous I/Os. However, the expansion capacity of most systems precludes using a controller per drive.
A single intelligent controller attached to four disk drives
Technological advances now make it possible to effectively include the capability of multiple non-intelligent controllers in a single intelligent controller. The controller can rapidly accept multiple I/O requests from the device driver, maintaining effectively simultaneous transfer operations to the attached drives, which are usually striped in a RAID array. In this situation, depending on the capability and configuration of the controller, reconfiguring SQL Server to allow a greater number of asynchronous I/Os could increase performance. The actual value used will vary, depending on the server and controller, and within a given server or controller by disk subsystem configuration, and within a certain disk subsystem configuration by I/O characteristics of the application.
Configuring max async IO

The max async IO configuration option configures the number of asynchronous I/Os that can be issued. The default is 8. This value should be changed only on systems with databases defined on multiple physical database devices that reside on separate physical disks or on systems taking advantage of disk striping.
It is recommended that the optimum value for the max async IO configuration option be determined by conducting controlled testing for a given situation, using either the Microsoft TPC-B Benchmark Kit or a customer-specific benchmark using the baseline setting of 8, then increasing the value slowly over subsequent test runs. When no further performance increase is noted, the optimum value has been found. In the absence of any empirical testing, the option should be left at the default setting.
SQL Server must be restarted for any changes to this configuration option to take effect.
Configuring max lazywrite IO
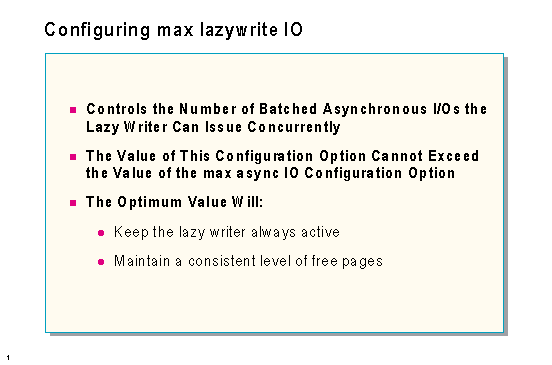
The max lazywrite IO configuration option tunes the priority of batched asynchronous I/Os performed by the lazy writer. This is comparable to max async IO, which controls batch I/O such as bulk copy and checkpoints, but max lazywrite IO is specific to the lazy writer. This option should be configured only on systems that have multiple hard disks. It is dynamically configurable up to the value specified by max async IO.
Changes to this configuration option take effect immediately.
Buffer manager configuration

Free buffers
Determines the threshold of free buffers available to the system. The minimum value is 20 and the maximum value is equal to one-half the number of buffers available when the server is started. The lazy writer process ensures that the number of free buffers available to the system does not fall below this threshold.
This option is automatically changed by the system whenever the memory option is changed; free buffers will be set to 5% of the available memory. When the memory option is changed, a message will be displayed describing the change to free buffers. After this change, free buffers can be manually reconfigured to any legal value.
Sort pages
Specifies the maximum number of pages that will be allocated to sorting per user. On systems that perform large sorts, increasing this number can improve performance. Because additional sort pages will consume memory, increasing this value can make it necessary to increase the amount of memory dedicated to the server.
Hash buckets
Sets the number of buckets used for hashing pages to buffers in memory. If the value specified is not a prime number, the closest prime number is used. For example, specifying 8,000 creates 7,993 hash buckets (the default). On systems with a large amount of memory, this value can be increased to allow faster access to data residing in data cache. For systems with 160 MB or less, 7,993 is an appropriate value. This option does not take effect until the server is stopped and restarted.
Recovery interval
Sets the maximum number of minutes per database that SQL Server needs to complete its recovery procedures in case of a system failure. The default is five minutes per database.
You might want to change the recovery interval as your application and its use change. For example, to guarantee that changes are frequently written to the disk, you can shorten the recovery interval when there is a lot of update activity. Shortening the recovery interval causes more frequent checkpoints, which slows the system slightly. On the other hand, setting the recovery interval too high might cause the recovery time to be unacceptably long.
Forcing pages to stay in cache
Partial syntax
sp_tableoption @TableNamePattern [, 'pintable'] [, true | false ]
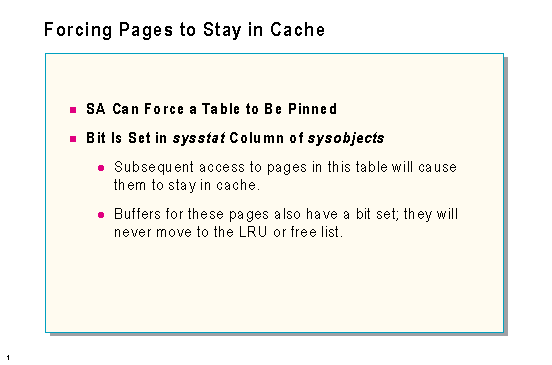
Setting the pintable option to true tells SQL Server to keep the table along with all of its indexes in the data cache. Pages belonging to a pinned table will not be flushed out of the data cache to free up space for a new page. Any modifications to such tables are fully logged, and the lazy writer and the checkpoint, in the normal fashion, write out dirty pages of all pinned tables.
Tables are marked as being pinned by setting a status bit in the sysobjects table.
This stored procedure does not automatically bring the table and index(es) into memory; as the data and index pages are being accessed, they are brought into the data cache and remain there until SQL Server is stopped or the value of pintable is set to false. To bring a pinned table into memory quickly, you can access it with a simple command such as SELECT COUNT(column_name) FROM table_name using a column that does not have a nonclustered index.
Pinning certain frequently used tables can provide significant performance improvements in certain environments. Always make sure that you have plenty of data cache remaining after pinning tables.
Wildcards can be used to specify the name of the table. This allows you to pin or unpin multiple tables. If the true or false value is not specified, the command will return the current setting of the pintable value for the specified table or tables.
Note There is no limit to the size of the table; a large table could consume the cache.
Forcing index pages to stay in cache
Trace flag 1081 allows the index pages to make a “second trip” through the data cache. When SQL Server needs to flush an index page out of cache to bring a new page in, it chooses a different page unless this particular index page has already been bypassed once. Therefore, index pages are allowed to stay in the data cache longer.
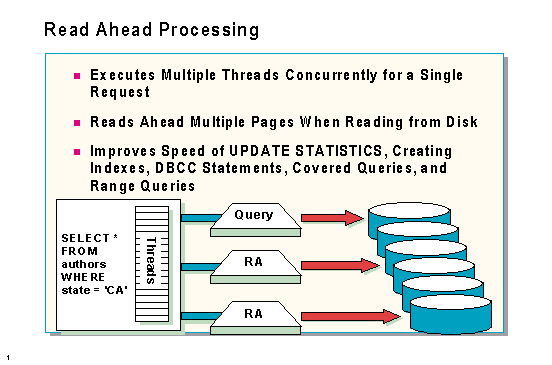
Read ahead is also called Parallel Data Scan (PDS). SQL Server uses this technique to reduce the number of physical reads necessary to process a query. If a certain number of needed pages are not found in cache, SQL Server can start other threads that will read pages that might be needed by the current SQL Server process.
Read ahead can be initiated any time SQL Server is doing a horizontal scan of the data. This can include table scans, index leaf-level scans for nonclustered indexes, DBCC statements, and UPDATE STATISTICS.
Read-ahead configuration
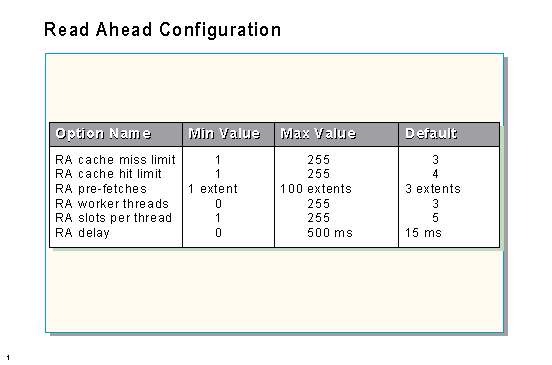
RA cache miss limit
Read ahead is initiated when this number of pages is NOT found in data cache while SQL Server is doing a horizontal scan of data. Setting the RA cache miss limit to one causes a read-ahead request to be made whenever a data page is accessed from disk, and it can lead to thrashing and poor performance.
RA pre-fetches
This value determines how far ahead the Read-Ahead (RA) Manager will read (on an extent basis) before the pre-fetch manager idles. A value of three means that for each request posted, the RA Manager keeps three extents ahead of the current scan position, following the page chain.
RA cache hit limit
Read ahead will stop after this number of needed pages are found to be already in cache and will restart on the first miss after that. This is used for detecting situations in which the Read-Ahead Manager finds everything in cache and is of little help to the query. The default value four should suffice for most systems.
RA worker threads
Each thread will manage a configurable number of structures (see the RA slots per thread option), where each of these structures (slots) represents an individual range scan. This option should be set to the maximum number of concurrent users on the system. A warning will be logged in the error log if the number of threads requesting read-ahead scans exceeds the number of configured RA slots. Setting this value to zero will disable read ahead.
RA slots per thread
This value specifies the number of simultaneous requests each read-ahead service thread will manage. The number of threads multiplied by the number of slots is equivalent to the total number of concurrent read-ahead scans that the system will support. The default value should be sufficient for most systems. If your system has an efficient I/O subsystem, you may be able to increase the number of scans that a single thread can handle.
RA delay
When the querying thread calls read ahead, there may be a slight delay between that time and the time the operating system wakes up the read-ahead thread. This delay option sets the amount of time the querying thread will sleep before resuming work-this ensures that the read-ahead thread will have started. Setting it to zero will essentially disable read ahead, because the querying thread will always be grabbing the next page before read ahead wakes up.
Examining and controlling read ahead

DBCC SQLPERF(RASTATS) returns four statistics. Sample output is shown below:
Statistic                        Value
-------------------------------- ------------------------
RA Pages Found in Cache          297.0
RA Pages Placed in Cache         12933.0
RA Physical IO                   1644.0
Used Slots                       0.0
The following table gives the meaning of each of the four values returned:
| Statistic | Definition |
| RA Pages Found in Cache | How many pages the RA Manager found already in the cache when trying to perform scans. |
| RA Pages Placed in Cache | How many pages did the RA Manager bring into the cache. |
| RA Physical IO | How many 16K reads did the RA Manager do. |
| Used Slots | How many RA slots are being used by active queries. Note that a single query may use multiple RA slots. |
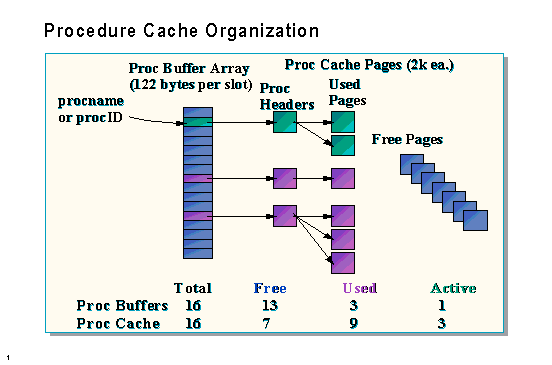
Procedure cache contains the following elements:
There are as many proc buffer slots as cache pages, stored in a fixed array. Each proc buffer slot uses 122 bytes of procedure cache. In DBCC MEMUSAGE output, the space needed to hold the proc buffer array is called Proc Headers.
Each used proc buffer slot points to a proc header, which is the first page of a procedure plan or tree in cache. This first page contains memory management information such as the addresses of the other pages in the plan or tree. It also contains a pointer to the first statement in the plan as well as the calling procedure (if any). That structure consumes 606 bytes of the first 2K page. The rest of the 2K page is available for plan or tree usage. Depending on the size of the plan or tree, there may be many additional pages associated with a plan or tree. In DBCC MEMUSAGE output, space available to be used as procedure cache is called Proc Cache Bufs.
Multiple plans for the same procedure each have their own proc buffer slot and proc header.

Procedure cache configuration option
The procedure cache value specifies the amount of memory that SQL Server uses to store most recently used stored procedures, to create new stored procedures, and to compile new queries.
The value given specifies the percentage of memory allocated to the procedure cache after the SQL Server memory needs are met. The SQL Server memory needs are the sum of memory necessary for locks, user connections, the code itself, and so on. The remaining memory is divided between the procedure cache and the data cache, according to the percentage set by this configuration option.
The amount of procedure cache needed for stored procedures, triggers, views, rules, and defaults depends on their number and size. Keep in mind that multiple users accessing the same stored procedure will cause SQL Server to create another copy of the procedure plan if there aren’t any unused copies in cache.
SQL Server must be restarted for any changes to this parameter to become effective.
Monitoring the usage of procedure cache
DBCC MEMUSAGE can be used to monitor the 20 largest procedures in the procedure cache.
The output from DBCC MEMUSAGE can aid in anticipating the amount of space needed for procedure cache. Since the output reports the size of the plans in cache, you can multiply this number by the expected number of simultaneous users.
Procedure cache can fill up in one of two ways:
If the procedure cache is full and a new procedure cannot be executed, error 701 is returned:
There is insufficient system memory to run this query.
Performance monitor counters
Object: SQLServer – Procedure Cache
Counters: Procedure Cache Size and Procedure Cache Used %
The Procedure Cache Size counter reports the size of procedure cache in 2K pages. This counter doesn’t change except when you change the value of the memory or procedure cache configuration options and restart SQL Server.
The Procedure Cache Used % counter monitors the percentage of the procedure cache consumed by cached stored procedures, triggers, views, rules, and defaults.
Ideally, you want the Procedure Cache Used % to be about 90% to 95% on a long-term basis.
If the Procedure Cache Used % counter is substantially lower, you have allocated too much memory for procedure cache and are wasting memory that could be used for data cache. Therefore, you should lower the procedure cache value, restart SQL Server, and continue monitoring this counter.
If the Procedure Cache Used % counter is constantly more than 95%, you may not have enough procedure cache allocated. In such cases, you should increase the value of the procedure cache configuration option, restart SQL Server, and continue the monitoring process.
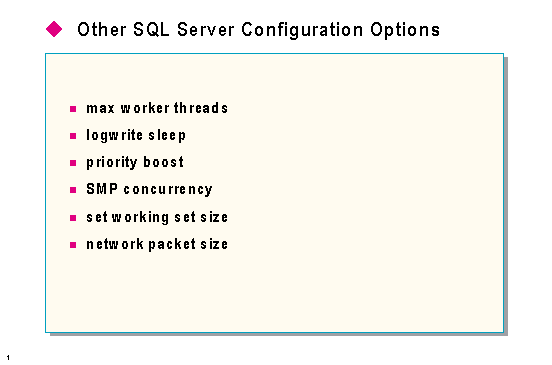
Max worker threads
Configures the number of worker threads that are available to SQL Server processes. SQL Server makes use of the native thread services of the operating system. Instead of one worker thread, there are many. Each network that SQL Server simultaneously supports is supported by one or more threads. Another thread handles database checkpoints, and a pool of threads handles all users.
With the max worker threads option, you can control the number of threads allocated to the user pool. When the number of user connections is less than max worker threads, one thread handles each connection. However, if the number of connections exceeds max worker threads, thread pooling occurs. Additionally, if the configured value for worker threads is exceeded, the next worker thread that completes its current task handles the request. The default is 255.
Logwrite sleep
Specifies the number of milliseconds that a write to the log will be delayed if the buffer is not full. This increases the chance that more data will be added to the log buffer by other users so that fewer physical log writes will be needed. Acceptable values for this option are 1 through 500. The special value of -1 means that the log write will not be delayed. The default is zero, which causes the server to wait only if other users are ready to execute.
Changes to this parameter take effect immediately.
Priority boost
Determines whether or not SQL Server should run at a higher priority than other processes on the same computer. If this option is set to one, SQL Server will run at a higher priority. The default is zero and should be changed only on Windows NT systems dedicated to SQL Server. Care should be taken to make sure other necessary processes (such as the network) are not being starved.
SMP concurrency
Controls the number of threads that SQL Server will release to Windows NT for execution, which, in effect, limits the number of CPUs used by SQL Server. On a uniprocessor computer, the optimal value is one. On a symmetric multiprocessor (SMP) computer, the limit depends on whether or not the server is a dedicated SQL Server. If the server is not dedicated, reconfiguring this value can cause poor response time to other applications running on the same machine. If response time for other applications is not an issue, set SMP concurrency to -1, “Dedicated SMP Support,” which means that there is no limit.
When SQL Server is installed, SMP concurrency will be set to zero, which means auto-configure. In auto-configure mode, the limit is set to n?1, where n is the number of processors detected at SQL Server startup. On a uniprocessor machine, this value will be set to one.
SQL Server must be restarted for any changes to this parameter to take effect.
Set working set size
Directs Windows NT to reserve physical memory space for SQL Server equal to the sum of the memory setting and the size of tempdb if it is in RAM.
Network packet size
Sets the server-wide value for the default network packet size. The client application can override this value. On systems using differing network protocols, this option should be set to the size of the most common protocol used. This option can improve network performance when network protocols support larger packets. If reconfigured, the change takes effect immediately. The default is 4,096.
Changes to this parameter take effect immediately.
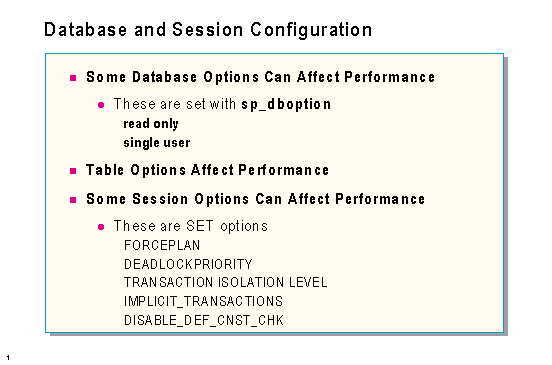
Database options
Database options can be changed only by the database owner or by the SA. Because they are stored in the master database, they cannot be changed by someone aliased to the database owner.
In both of these cases, no locks will be acquired or checked for any operations. As will be discussed in the next module, contention for locks is one of the most serious performance issues in a multi-user environment.
Other database options can affect performance in more indirect ways. The trunc. log on chkpt. option introduces extra system overhead every time the system checkpoint process runs. You can use the select into/bulkcopy option to run fast bulkcopy or SELECT INTO operations, which are much faster than the alternatives.
Table options
There are also table options available that can affect performance. These are set with sp_tableoption. One table option, pintable, has already been discussed. Another, insert row lock, will be covered in the next module.
Session options
Session options are controlled by the SET command and are only in effect for the duration of the session. If they are turned on in a stored procedure, they are in effect until the stored procedure completes.
The following session options can impact the performance of queries:
FORCEPLAN
Makes the SQL Server optimizer process joins in the same order as tables appear in the FROM clause. FORCEPLAN essentially overrides the optimizer.
DEADLOCKPRIORITY {LOW | NORMAL}
Controls how this session reacts when in a deadlock situation. If set to LOW, this process will be the preferred victim of a deadlock situation. Use the NORMAL option to return the session to the default deadlock-handling method.
TRANSACTION ISOLATION LEVEL
Controls the default transaction locking behavior for all SQL Server SELECT statements for this connection. The various values will be covered in the next module.
IMPLICIT_TRANSACTIONS
Controls whether a transaction is started implicitly when a statement is executed. The performance implications of this behavior will be covered in the next module.
DISABLE_DEF_CNST_CHK
Specifies interim deferred violation checking. The meaning and performance implications of this option will be discussed in a later module.
© 1997 Microsoft Corporation. All rights reserved.
The information contained in this document represents the current view of Microsoft Corporation on the issues discussed as of the date of publication. Because Microsoft must respond to changing market conditions, it should not be interpreted to be a commitment on the part of Microsoft, and Microsoft cannot guarantee the accuracy of any information presented after the date of publication.
This document is for informational purposes only. MICROSOFT MAKES NO WARRANTIES, EXPRESS OR IMPLIED, IN THIS DOCUMENT.
Microsoft and Windows NT are registered trademarks of Microsoft Corporation.
Other product and company names listed herein may be the trademarks of their respective owners.