Configuring Performance Charts in System Monitor

System Monitor uses the dynamic data information in the Registry to report on the state of processes. You can use System Monitor to do the following:

To use System Monitor to track performance problems

  1. Click the Edit menu, and then click Add Item.
  2. In the Category list, click the resource that you want to monitor.
  3. In the Item list, select one or more resources that you want to monitor.

    To select more than one item, press CTRL while clicking the items that you want to select. To select several items in a row, click the first item, and then press and hold down shift while clicking the last item.

    For more information about a selected resource, click the Explain button, which is dimmed until after step 3.
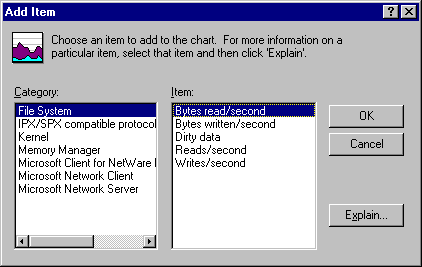
  4. Click OK.

    To change the view of the data from a line chart to a bar chart or a numeric listing, click the related button on the button bar.
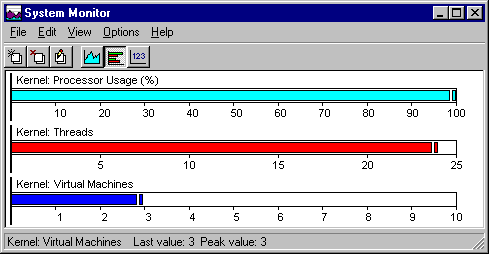
System Monitor offers menu commands for configuring the charts: