Identifying Performance Problems with System Monitor
If you want to use System Monitor effectively, you need to run it frequently to become familiar with what typical performance looks like for a standard configuration so that you can recognize performance problems when they appear in System Monitor.
To become well-acquainted with System Monitor, run it while you are doing your usual work under Windows 95. To do this, add the System Monitor icon to your desktop. Then run System Monitor and use commands on the View menu to remove the title bar or to force the window to be always on top.
The following presents some general guidelines and key settings for using System Monitor in troubleshooting performance problems:
- If you suspect a application might not be freeing memory when it finishes using it (sometimes called memory leaks), monitor the value of Kernel: Threads over time. This will indicate whether the application is starting threads and not reclaiming them. Windows 95 automatically removes such threads when the application closes, but if you identify a leak while the application is running, you might decide that you should restart the application periodically.
- If the values for Memory Manager: Discards and Memory Manager: Page-outs indicate a great deal of activity, performance problems might be related to system memory stress. These values might indicate a need for more physical memory.
- If a computer seems slow, check the values reported by Kernel: Processor Usage (%) and by Memory Manager: Page Faults and Memory Manager: Locked Memory, as described in the following list:
- If values for Kernel: Processor Usage are high even when the user is not working, check to see which application might be keeping it busy. To do this, press CTRL+ALT+DEL to see the list of tasks in the Close Program dialog box.
- If the values for Memory Manager: Page Faults are high, it might indicate that the applications being used have memory needs that are beyond the computer's capabilities.
- If the Memory Manager: Locked Memory statistics continually are a large portion of the Memory Manager: Allocated Memory value, then inadequate free memory might be affecting performance. Also, you might be running an application that locks memory unnecessarily. (Locked memory indicates the portion of memory used that cannot be paged out.)
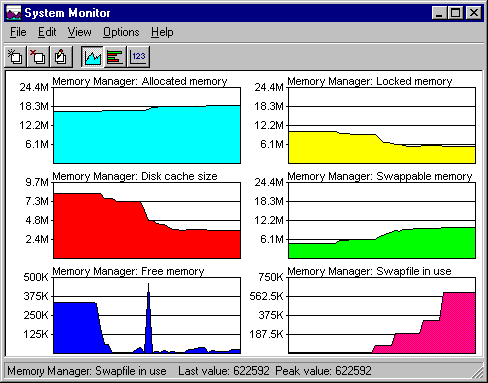
The following basic example shows several memory management statistics over a few minutes while Windows-based word processing, spreadsheet, and mail applications were loaded and several files were opened.


