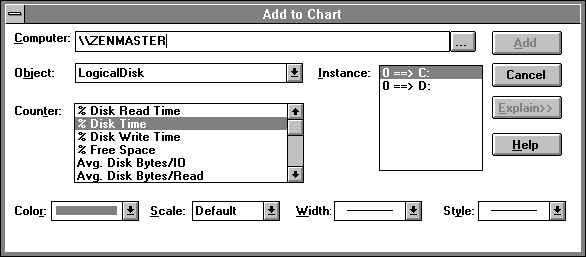
The first step in selecting a counter for measurement is to choose Add To Chart from the Edit menu in Performance Monitor.

Figure 2.12 Add To Chart dialog box
Each time you select a counter you must provide the name of the computer you want to measure. By default, this is your local computer.
If you don't want to look at an object on your local computer, you can enter the name of another computer. You must have the Access This Computer From Network right on that other computer, or you will be unable to monitor it. To select the computer on which you want to monitor this counter, type its name in the Computer box. If you type in the name of a Windows NT computer, be sure to enter the leading backslashes (\\). These are not supplied automatically by Performance Monitor because they might not be included in the name of foreign (non-Windows NT) computers. (Extensible objects can be created for measuring objects on foreign computers. For more details, see Chapter 13, "Adding Application Performance Counters.")
If you can't remember the name of the Windows NT computer you want to monitor, you can choose the ellipsis button to the right of the Computer box. This brings up the Select Computer dialog box. The computers in your own domain are automatically listed for selection. You can double-click icons representing other domains to see a list of computers in those domains.
You can start Performance Monitor looking at a particular remote computer with the following command syntax:
perfmon -c \\computername
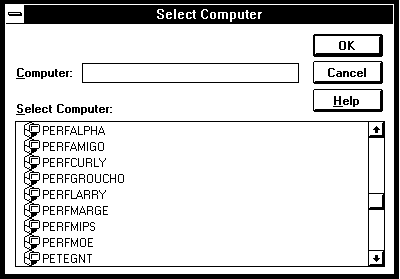
Figure 2.13 Computer Selection dialog box
You can collect data simultaneously from as many computers as you want. You must point at each computer to select the data you want to collect from it. Obviously it can be a lot of work to perform this selection process. You can save your selections in a settings file, and reload those settings later. We'll go into that in "Saving Settings," later in this chapter.
The Add to Chart dialog remembers which computer you last selected so you will not have to re-enter the computer name if you need to revisit the dialog.
Remote measurement does not carry a large overhead. Even better, you can measure that overhead. You should do so to become aware of what you are doing when you collect data from a remote computer. Each time interval, you will be visiting that remote computer and gathering data on the objects that you specified. We call each such visit a snapshot. You can use Performance Monitor to determine the overhead of a snapshot. You can monitor the network protocol objects to determine the number of bytes being transferred across the network, and the processor overhead on each machine. See Figures 2.14 and 2.15 for examples of overhead.
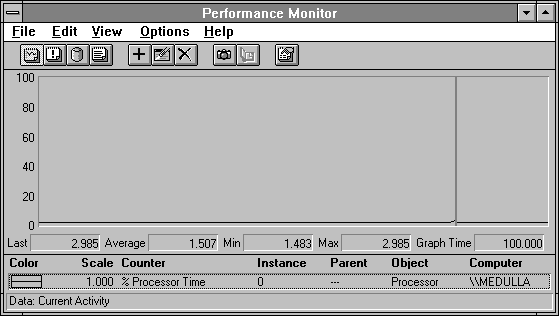
Figure 2.14 Overhead of remote monitoring on the monitored computer
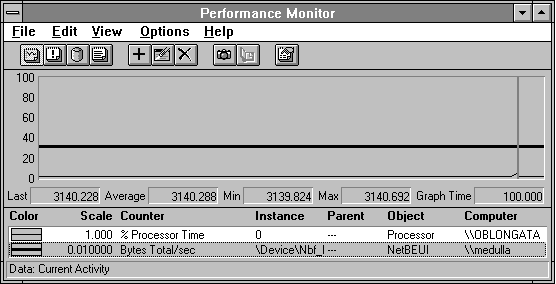
Figure 2.15 Overhead of remote monitoring on the monitoring machine
If a computer is shut down while you are monitoring it, Performance Monitor receives a time-out while attempting to access that computer. Later, it will retry the access. When the computer starts again, Performance Monitor succeeds during the operation. During the initial failure, Performance Monitor stops data collection while it times out. The time-out value defaults to 20 seconds. The time-out time is also incremented by this amount for every five computers you monitor. The time-out value can be changed, and is stored in milliseconds in the Registry location HKEY_CURRENT_USER\Software\Microsoft\Perfmon\ DataTimeOut.
When you measure data from many computers, Performance Monitor starts a separate thread for each remote computer being measured. The threads concurrently collect data from the various computers. The computers will most likely respond at slightly different moments in time. Even though the data is shown as though it was collected simultaneously, this is only approximately true. It's a fine point, but that's why you're reading this, right?
There are no intrinsic limits on the number of computers you can monitor simultaneously, but limited hardware resources can make measuring too many at once impractical. If you find you are clogging your computer or network with measurement data, there are a number of tricks you can employ to reduce your overhead.
First, collect data less frequently by increasing the time interval of your data collection. Overhead is inversely proportional to the time interval, so doubling the time interval will halve the overhead. This relationship between time interval and overhead is a basic design principle of Performance Monitor. You can make an explicit trade-off between the overhead and the resolution of your measurement. Greater resolution (smaller time interval) has greater overhead and thus affects the measured system's performance more.
Next, reduce the number of objects you are monitoring. The Thread object is the most expensive to monitor, because a plain vanilla Windows NT system has over 100 threads. Next in line in amount of data collected is the Process object. Remove objects in a disciplined manner, watching the effect on your network protocol byte counters. This tells you the impact of your changes.
This brings us to Rule #1. Along the way in this book, we have included a lighthearted "10 Rules of Bottleneck Detection." These rules are simple guidelines or reminders about what you should do or watch out for when you hunt bottlenecks on your computer systems. And Rule #1 is: When hunting for a bottleneck, make only one change at a time.

If the overhead of graphing counters on your system is too high, consider using alerts instead of charts to monitor a large number of computers simultaneously. The same amount of data is transferred across the network, but the local cost to display is lower as long as the alert thresholds are not triggered too frequently. Again, by measuring your overhead, perhaps with another copy of Performance Monitor, you can determine the effects of your changes.
If you are charting data from many computers, you may find it useful to run more than one copy of Performance Monitor. Each copy could be monitoring a particular type of counter. One could monitor Processor: % Processor Time from each computer, another could measure Memory: Pages/sec, and so on. This permits deviant behavior to be spotted easily.
Last but far from least, you may wish to start a Performance Monitor service on each remote computer. This limits network traffic to the times you desire. See the section below on the Performance Monitor service for more information.