It's sort of boring to log data, but it's very exciting to play it back. To play back a log file, choose Data From in the Options menu, then choose Log File and type the log file name or choose the ellipsis button to access the Open Log File dialog box.
Viewing data from a log file is very similar to viewing current activity. You can create charts, alerts, reports, and even new log files. But because the data already exists, you don't have to wait for it to materialize, and this changes the views in subtle but important ways.
You select objects, counters, and instances for charts of logged data just as you do when charting current activity. But the display of time on the chart is different.
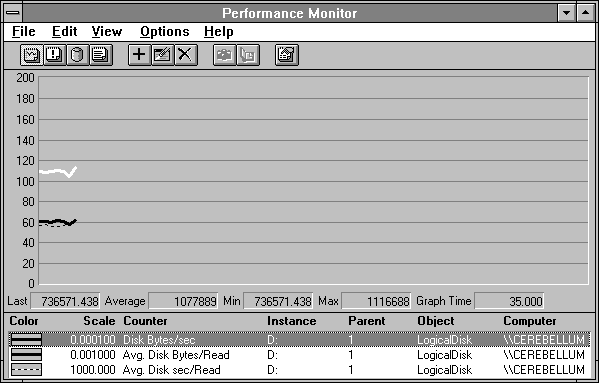
First consider charting in the graph mode. (We talk about histogram mode in "Histograms of Logged Data," later in this chapter.) There is no vertical time line in charts of logged data. Instead, Performance Monitor attempts to graph 100 points, which fills the chart window. If there are fewer than 100 data snapshots in the log file, you will see every point graphed, and the graph will not reach the right hand edge of the window. If you look at the Chart Options dialog box, you will see that the Update Time group is unavailable because it is not relevant when playing back a log.
Log files are self-contained. You can take them to any Windows NT machine for viewing. However, there is no Explain text in the log file, a decision we made to conserve log file space. To see counter explanations you have to use Performance Monitor on Current Activity (or see Appendix A of this book).

Figure 2.33 Chart of a log file with fewer than 100 snapshots
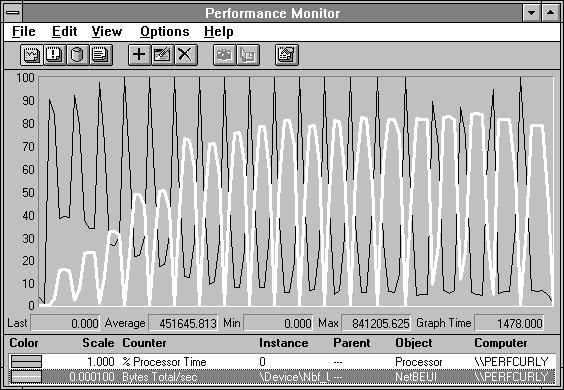
If there are more than 100 snapshots in the log file, the graph fills the window. Suppose you have a log file with 1000 data points; every tenth point will appear on the graph. If you need to see every point, you can look at portions of the log file by choosing the Time Window command from the Edit menu, or you can export the chart. (For more information on exporting, see "Exporting Performance Data," later in this chapter.)

Figure 2.34 Chart of logged data with more than 100 snapshots in the log file
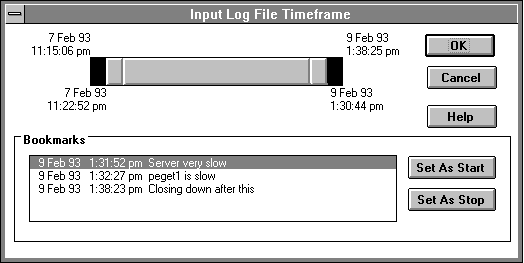
To move around in time in a log file, choose the Time Window command from the Edit menu. This brings up the Input Log File Timeframe dialog box. Use the slider bar in this dialog box to change the time window shown in the chart. You can change the starting time and the ending time of the time window by dragging the start and end panels of the slide bar. You can move the whole time window by dragging the center section of the slide bar. You can also click the portions of the slide control not covered by the current time window to page through the file. The times above the slide bar are the start and end times of all the data in the log file. The times below the slide bar are the current start and end times.
You can use the left and right arrow keys to expand the time window. By pressing the SHIFT key and holding it down while pressing the arrow keys, you can contract the time window. Even though the chart shows only (at most) 100 of the data points in the current time window, the arrow keys move only one of the underlying data points each time they are pressed. This permits precise control of the time window endpoints.

Figure 2.35 Anatomy of the Input Log File Timeframe dialog box
When you move the left end of the time window slide bar, you can see a gray bar move across the chart. It shows the current location of the time window start that will be set if you press OK. Set the end of the time window the same way.
Below the slide bar control is a box displaying any bookmarks you've placed in your log file. You can select a bookmark and assign it to be the start or the end of the current time window. You can't set the end of the time window to be earlier than the start. Magic it's not.
The time window is very important because it determines the start and the stop snapshots for all of the following:
This means that changing the time window on the chart is how you manipulate which data is visible in all four views.
You'll remember that some instances, like those of the Process or Thread objects, are called mortal instances because they start and stop while the system is running. Anyway, this can be a bit of a problem, because you need to have your time window start while they are alive if you want to see them in the Add To dialog boxes. This is one good reason to insert a bookmark saying "Application started" in your log file. This will help you to set the time window to a period of time when the application is running. You can also use the setedit utility discussed in "Saving Settings," later in this chapter.
Once you have selected the application instance, you can move the time window freely. Counters will appear to go to zero during those time intervals when the application is not running.
Now we're going to touch on an even more obscure point regarding the display of logged data. As mentioned above, in those cases where there are more than 100 data points in the log file, you are missing some data in the initial chart because some snapshots are skipped over and not displayed.
To be certain of what you are seeing, you will want to mentally separate counters into two types: those which are averages over time, and those which are instantaneous values. Most counters are time averages, such as Server: Bytes Total/sec or Processor: % Processor Time (which is the ratio of time used to the time interval, expressed as a percentage). Counters like these, that are an average over time, continue to be proper averages over time even if some time intervals are skipped. This is equivalent to smoothing the data by computing a simple average. So if you have more than 100 data points, that is, your chart fills its window, you can properly think of the chart as smoothing the data in the log file.
But there are a few counters, such as Memory: Available Bytes, that are not averages, but instantaneous values. We call these instantaneous counters. We try to be careful about noting that a counter is instantaneous in its Explain text. This fact is also noted in Appendix A, where such counters have the counter type Raw Count. An instantaneous counter is not an average over the time interval, but rather the value of the counter at the end of the time interval. Therefore, skipping data points can hide peaks and valleys that might be important.
There are three things you can do about this. Number one is to just forget about it, under the assumption you have enough real problems. Number two is to change the time window you are viewing in the log file to see fewer than 100 data points. Number three is to choose Export from the File menu to export the chart. When you export a chart of logged data, all the data points inside the current time window are exported whether they appear explicitly in the graph or not. More about this in "Exporting Performance Data," later in this chapter.
As when viewing current activity, histograms of logged data are useful for looking at the data from many instances. But the height of each bar in the histogram is a function of the time window. If the counter is a time average, the height indicates the average over the current time window. If the counter is an instantaneous value, the bar height indicates the value at the end of the time window.
The value bar numbers pertain to the 100 or fewer data points you see when you switch to graph mode. The histogram itself is based on the snapshots at the start and end of the time windows. If there are more than 100 data points, and the counter is a time average, the histogram displays the correct average, and the value bar displays an estimate based on the 100 data points you see in graph mode. So if these differ, don't panic.
If you need to be picky about these numbers, you might want to export the data and process the values in a spreadsheet. For more fine points on exporting data, see "Exporting Performance Data," later in this chapter.
Reports of logged data are the numerical form of histograms of logged data. For time-average counters the counter value at the start of the time window is subtracted from the counter value at the end of the time window, and the result is divided by the time span of the time window. This means all of the considerations just mentioned concerning histograms of logged data apply to reports of logged data. Suffice it to say that the reported number is an accurate average, whereas the graphed number and the value bar values can be estimates because of skipped data points.
For the most part you can ignore these issues. Just set the start of the time window on the start of the event of interest, and the end of it at the close of the event. Voilą.
A comment was made in the earlier section "Gory Details on Charting Log Data" about selecting mortal instances. That note applies equally to reports on mortal instances.
If you have a lot of logged data, you might want to find the hot spots quickly. You can use alerts on logged data to do this. Usually, you would first chart the data, and set the time window to some period of interest. Then choose Alert from the View menu and set the alert condition you are concerned about. Perhaps this is some indicator of heavy load, such as System: Processor Queue Length > 3. The logged data is scanned and the alert conditions located and placed in the alert log on your screen. You can export the alert log entries for further processing.
Unlike charts and reports, the time interval is relevant here. Suppose you have logged data at a 15-second time interval. You can look for an alert condition at, for example, a one-minute time interval. In this case, the Alert view scans the logged data looking for a snapshot that is at least one minute past the start of the time window. It then computes the time average for the counter over that minute and checks against the condition. Then, using the ending snapshot as the start of the next time interval, it looks for another snapshot that is at least one minute later. This continues to the end of the log file. If you have set an alert on an instantaneous counter, the value at the end of each time interval determines if the condition is met.
Once you have chosen a log file in the Data From dialog box, your data source is that log file. You can then select the Log command from the View menu and relog that data to a new log file.
Why on earth might you want to do such a thing? Actually, there are a number of good reasons for relogging. The first is to create an archive. If you have a file of logged data you really care about, you might want to append it to an archival log for long-term storage. You can do this, as we mentioned, by supplying the name of the archive file as the output log file. This keeps you from having to save lots of individual log files, which can be a nuisance.
You can select a longer time window when you relog. This permits you to condense your data. If you collect data at a one-minute time interval, and relog at a five-minute time interval, you condense your data to use only 20% of the space. For this, your boss should give you a bonus!
When you relog data, you can use the time window to limit the data. This means that you can log a 24-hour period, but archive only that portion of the day that has peak activity. Looks like another bonus!
A log file of relogged data is just like a log file of new data. Such a file can be designated in the Data From dialog box, and can even be relogged itself.