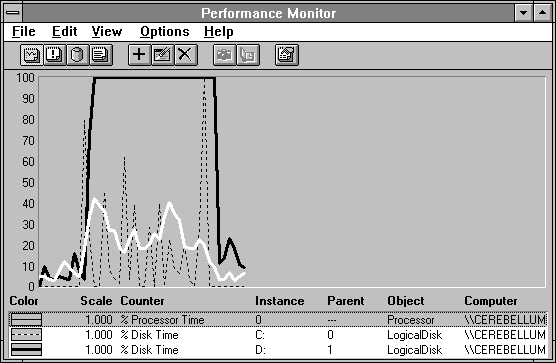
Let's take a look at another case. You know so much now, we can present Performance Monitor information without comment. Look this over and form your own conclusions, and then read on.

Figure 10.12 Overview of an application without a processor problem
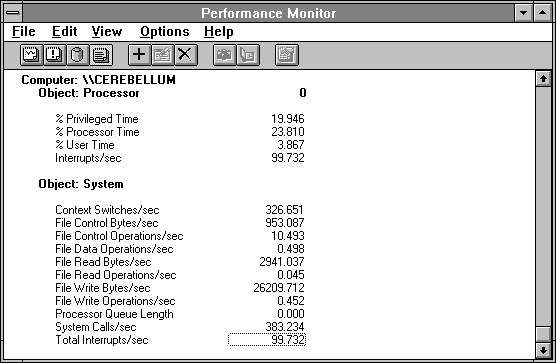
Figure 10.13 System and processor views of an application without a processor problem
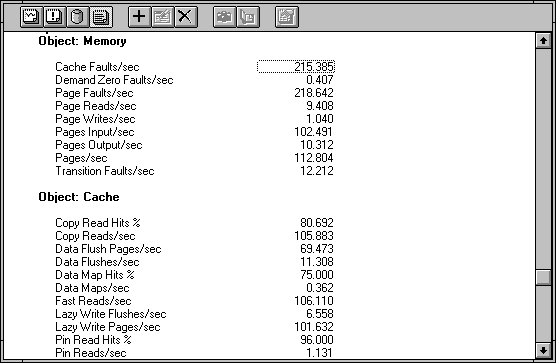
Figure 10.14 Memory and cache views of an application without a processor problem
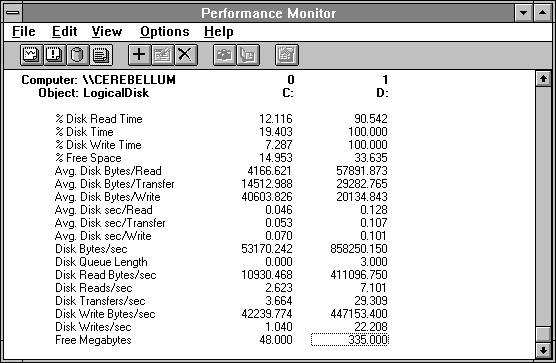
Figure 10.15 Logical disk view of an application without a processor problem
You've convinced me, the disk is the bottleneck here. Now what can we do about it? It's not going to do us a great deal of good to use the tools we've shown so far, although we might be able to deduce which files are in play by seeing which functions of the program are busy. (There's a bit of fun detective work to try.) We have an easier, softer way.