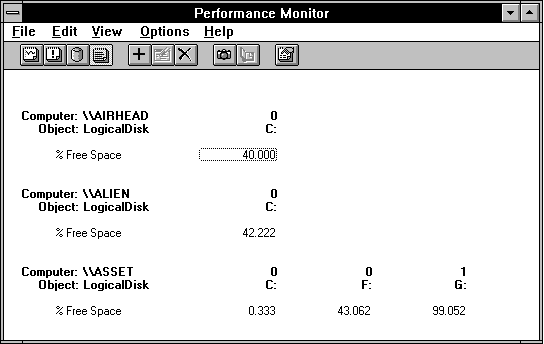
The report is useful for observing the values of many counters at once. It is helpful in deciding which counters to place on a chart. As an activity progresses, you can see how the many values change and which ones are key to the activity you are observing. Figure 2.25 shows a report with counters from multiple computers.

Figure 2.25 Report with counters from multiple computers
You can select multiple counters and multiple instances for a report just as you can for a chart. But unlike charts, there are no special display features for reports. In particular, there is no scale factor because you can always observe the entire counter value.
As you add objects and counters, they are added to the bottom of the report. Very soon they will extend beyond the windows, and you will get a vertical scroll bar which you will have to use to see them. Instances are added to the right, with their names (and, if present, their parent's names) above them. When they will no longer all fit in the window, you get a horizontal scroll bar. If you want to see many instances at one time, you might have to start multiple copies of Performance Monitor and watch several instances in each. At about this point you should consider using logging, or exporting of the report data, but you'll be sacrificing the real-time view. Tradeoffs!
The only option in Report view is for the time interval. The default time interval is five seconds. This gives you time to read several values before they change. You can set this to any value you want, and as with the chart, you can choose Manual Update mode. As always, there is more overhead if you update more often.
You may notice a delay before the first counter values appear. In the meantime, you will see minus signs, indicating that data is missing. As with the chart, a report needs the snapshot of the counters at the end of two time intervals before you see any data. By default, it is 10 seconds before you see values. If you get impatient, take a couple of snapshots with the camera icon on the toolbar to get some preliminary data.
All the counters for a particular computer are grouped together. Objects reported for that computer are listed in the order you select them. Counters for each object are listed from top to bottom in the order you select them. If you select multiple counters of an object and then choose Add, they are listed in alphabetical order. Instances for each object are listed in the order in which you select them for measurement. Likewise, if you select multiple instances of an object and then choose Add, they are added in alphabetical order.
By heeding these properties, you can arrange reports to your liking. If this lacks the flexibility you need, you should choose the Export command from the File menu for manipulation by a spreadsheet or database report writer (for details, see "Exporting Performance Data," later in this chapter).
You can delete a report counter by selecting it with the mouse and choosing Delete from the Edit menu, or by using the appropriate toolbar icon. To prevent accidental deletion, there is no hot key. If you delete all the counters for an instance, the instance is deleted. But it is quicker to select the instance name and use the Delete key to delete all its counters. If you delete all the counters for an object, the object will be deleted. Again, it is simpler to select the object name and delete it. The same is true for computer name. But there is no way to select multiple counters to delete.
You can clear the current report data by choosing Clear Display from the Edit menu. This leaves your selections in place but starts the report over again from the left edge. You can clear all your selections and stop reporting altogether by choosing the New command from the File menu. This creates a new settings file and clears your old settings.