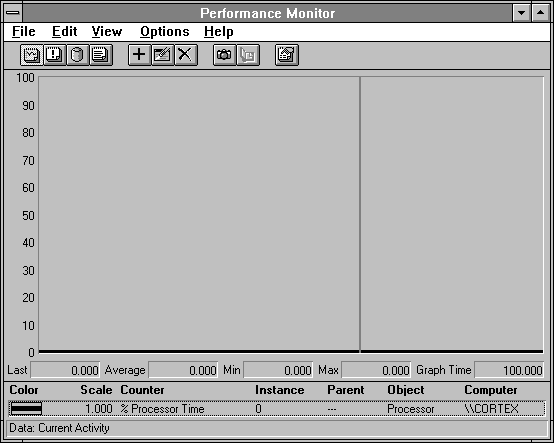
One design goal of software performance monitors is to keep their overhead low. Figure 3.8 shows a chart of the processor used by Windows NT Performance Monitor observing an idle system. Look at the value bar. Because the graph time is 100 seconds, we know the time interval is one second, so the chart is being updated every second.
Figure 3.8 Windows NT Performance Monitor overhead (not!)
Notice how the value bar entries are zero. Wow, no overhead! What a tool! Do we think Windows NT Performance Monitor is free? Fat chance! It is good, but it is not free. It does have very low overhead, because it was used to tune itself, and we also followed all the guidelines we will mention in later chapters about how to write fast Windows NT applications. But it is also true that processor utilization on Windows NT 3.1 is sampled, not measured; the sample rate depends on the hardware platform. Sampling whether the processor is busy is much less expensive than timing every processor thread dispatch, because only more advanced processors include cheaply readable timers. On the 486 and earlier processors, time must be obtained from a relatively slow outboard Timer (See Figure 2.1.)
Anyway, what sampling means to you is that a process can execute a few instructions and stopall in between samplesand thus not be observed. This places a lower bound on the resolution of this counter. On both 486 systems and MIPS systems, the sample rate is once every 10 milliseconds. When the timer ticks, the interrupt looks to see what the current process and thread are, and then effectively bills them for a sample interval's worth of time as though they had executed for the entire sample interval. Clearly, this scheme can overcharge if the thread started just before the interrupt, or undercharge if the thread stops just before the sample interrupt (as is the case repeatedly in Figure 3.8). Programs (like Performance Monitor) that are launched by the same interrupt used to sample processor usage are particularly difficult to measure perfectly. The utility TotlProc included with this book exports a counter for measuring this sort of deviant behavior. In almost all cases, the counter will be correct. The counter is designed to tell us about which processes and threads dominate the processor, and it can certainly do that with low overhead using this scheme. But if we try to look too closely at deviant or unusual thread behavior, we will see the limits to the resolution of this counter.