Windows NT uses a couple of different protection mechanisms, and at the root of them all is the distinction between user mode and privileged mode. In user mode, the application is restricted in a number of ways. It cannot access the peripherals directly, but must call Windows NT to get or change peripheral data. This lets Windows NT assure that one application will not destroy data for another. When an application is in user mode, it also cannot read or change data maintained by Windows NT itself. This prevents applications from corrupting Windows NT either inadvertently or intentionally. When an application needs Windows NT to do something, it calls one of the system routines. Many of these make the transition into privileged mode, perform the required operation, and return smoothly to user mode.
Other protection mechanisms in Windows NT, such as the subsystem model, are built on the transition between user and privileged mode, and we'll explore that shortly. The highest level of protection is provided by the Windows NT security model. We measure it when necessary by looking at these lower levels on which it is built.
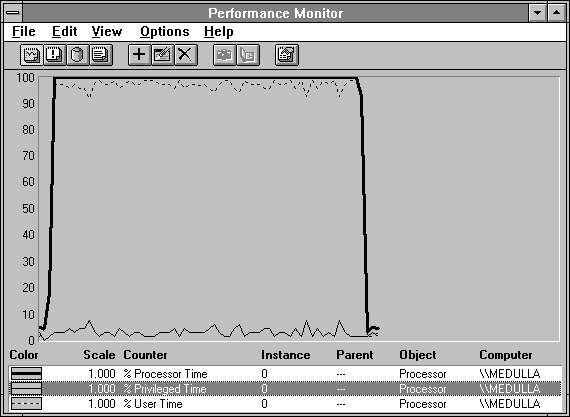
Figure 3.12 shows the processor modes in the previous example. The dotted line is Processor: % User Time, or the percentage of time spent in user mode. The thin black line at the bottom of the chart is Processor: % Privileged Time. Almost all of the processor time is being spent in user mode, and there is very little privileged mode activity. This application is chewing up the processor in user mode and requires very few system services.

Figure 3.12 A self-absorbed application obsessed with user-mode processing
Figure 3.13 tells a different tale. Here we have measured a single process that is retrieving file data, and consequently spending most of its time in privileged mode. This is not necessarily bad, it just means that the application is getting its work done by calling the operating system. When user mode time goes up, privileged mode time goes down. Together they add up to all the processor time being used, if we got our arithmetic right when we built Performance Monitor. (And we did; we checked.)
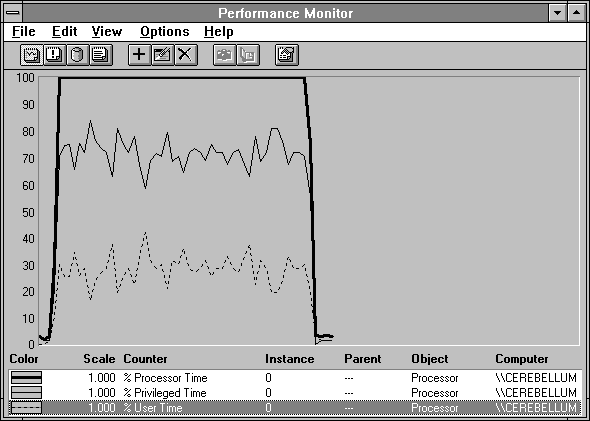
Figure 3.13 A process wisely using Windows NT to get its work done
Performance Monitor enables you to get an overview of a few basic areas where an application might be spending its time when it is using the system in this fashion. Figure 3.14 shows some of the key counters to note in this situation.
You may notice that % Processor Time appears in the report before % Privileged Time. This is logical, which is why we have done it here, but it is not what you get if you just select all Processor counters and add them to a report. Report counters appear in the order selected. If you select all counters at once, they appear in alphabetical order. By first selecting % Processor Time, adding it, and then selecting all Processor counters and adding them, you will get the report shown here. Adding the % Processor Time a second time has no effect because duplicate additions are ignored.
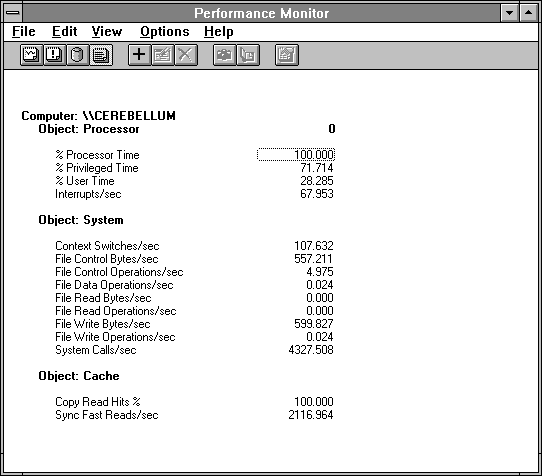
Figure 3.14 Some key indicators of system call activity
The Processor: Interrupts/sec counter is near its rest state of 101.057 on the x86 processor. (This rate reflects the rest state because the processor clock interrupts every 10 milliseconds on x86 computers.) It is a bit higher because we are logging performance data once each second. A large number of interrupts could press privileged time up, but that is not happening here. Windows NT is capable of sustaining thousands of interrupts per second; that's how we know this number near 66 is low.
The Context Switches/sec rate is quite low, so the application is not switching to another process, or switching among multiple threads within itself. This is another counter capable of being in the thousands; we'll see examples of this later.
All the file operation counters are very quiet as well, so we're not beating on the Windows NT file system for data. (How could that be, when we were getting file data? Hang on and you'll see.) System: System Calls/sec measures the number of times the application is calling Windows NT, and thus counts the transitions into and out of privileged mode from user mode. We can compute the amount of time between each call:
Time / System Call = 1 / (System Calls/sec) = 1 / 4327.508 = 0.000231
or 231 microseconds. User time per system call is the ratio of % User Time (expressed as a number from 0 to 1, this is the fraction of each second in user mode) to System Calls/sec
User Time / System Call = 0.28285 / 4327.508 = 0.000065
or, 65 microseconds. And, finally
Privileged Time / System Call = 0.71714 / 4327.508 = 0.000166
or, 166 microseconds.
All this tells us that the application is making a very large number of system calls each second (on average), and each one is quite fast.
We turn our attention to another key Windows NT component, the file system cache. Windows NT uses a single cache for all file systems. Before going to fetch the data from disk or LAN, the file system first asks the Windows NT I/O Manager if the data is in the cache. If it is, the file system bows out and the request is fielded by the cache manager. We'll say more about all this later, primarily in Chapter 6, "Detecting Cache Bottlenecks."
What we see here is a 100% hit rate in the cache for copy reads, meaning every time the cache manager is asked for such data, it is there. Copy reads are those in which the cache manager is directed to satisfy the request by copying the data from the cache to the application's buffer. (Reminder: this sort of information is in the Explain text for the counter.) We also see a high rate of Sync Fast Reads/sec. This is the key to the absence of file system activity in the file counters. Sync here means the application will wait until the request is finished. Fast reads are special I/O Manager operations which bypass the initial call to the file system and go directly to the Cache manager. So the file system never got called, and never had a chance to bump its File Read Operations/sec counter.
We can see how these cache requests relate to the overall system calls by forming another ratio:
System Calls / Cache Request = 4327.508 / 2116.964 = 2.04
Just about every other call is a call to get data from the cache. To get more detail on the calls and the amount of time spent in them, you would use the Call/Attributed Profiler (or a similar tool), which is described in Chapter 10, "Tuning Windows NT Applications."
We've gotten a pretty good idea what is going on here, and we know what tool to use to get more information. We've also exposed another important Rule:
