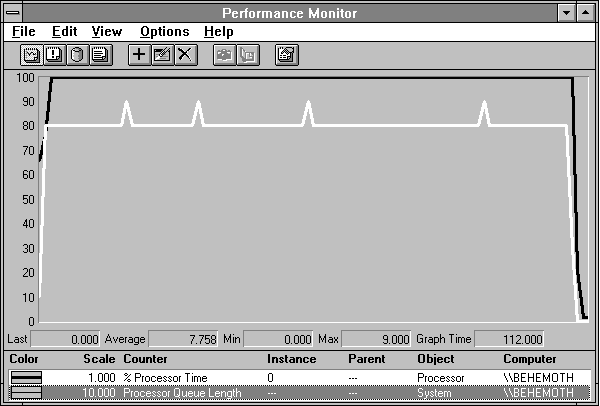
In the previous chapter we illustrated multiple processors as just additional hardware resources, and so they are. If you are a product of the personal computer era, thinking of multiple processors as you think of multiple disk drives might be a bit of a strain at first, but you'll get used to it. In the next example we are running eight processes on an eight-processor system, which we started artificially with only one processor running, and we see the expected contention.

Figure 3.39 Eight processes in one processor
We see the processor utilization at 100% in black and the highlighted queue length in white. In the next figure, we see the processor is indeed shared equally among the eight processes. Unfortunately they are all running at about 12.5% of full speed, and if we were waiting for them we'd probably be complaining about how slow they were. The output from Response Probe tells us that on average they are taking 8.05 times longer than the response time of a single process running in a single processor doing the same amount of work.
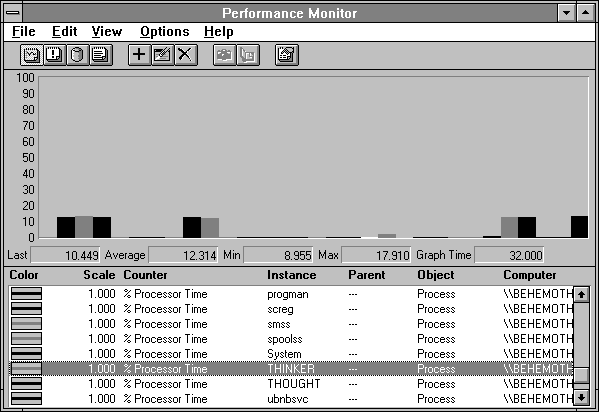
Figure 3.40 Processor time distribution among eight processes in one processor
Let's restart the same system with all eight processors active and redo the experiment.
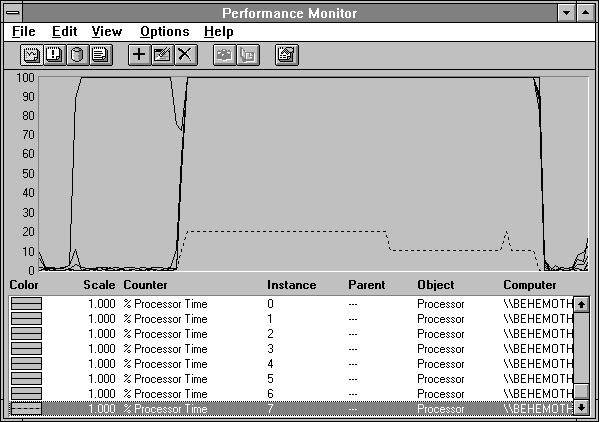
Figure 3.41 Eight processes on eight processors
The first processor busy at 100% is a single processor handling Response Probe while it is doing its processor calibration. During this phase, Response Probe determines the number of times it must execute its basic computation loop to use up one millisecond of processing time. Later it will use this information to apply the amount of processing you request. Once it has calibrated, the probe starts the eight processes. Each one starts executing. The processor queue length (the dotted line) goes way down from our last example. On closer inspection, we'd find that the threads waiting in the processor queue are system processes waiting to complete housekeeping functions at a lower priority.
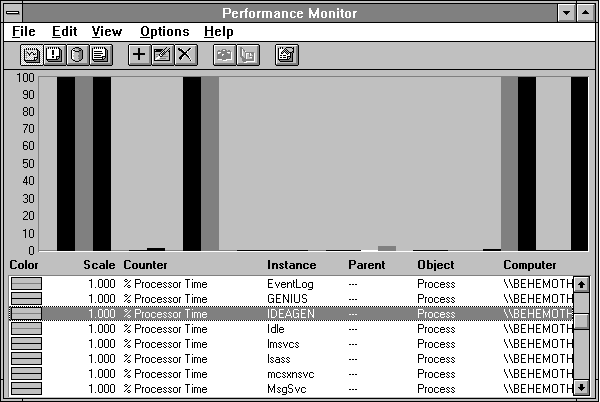
Figure 3.42 Processor use by eight processes on eight processors
Figure 3.42 shows that each process is using 100% of a processor. This time the output of Response Probe tells us that each one is getting exactly the same response time as a single process running on a single processor. We are getting eight times the work done.
For each processor we added, we got 100% of a processor's worth of work done. Life is not always this rosy in multiprocessor land. There are a number of reasons why adding processors might not yield the response time improvements we see in this idealized experiment. For example, if the bottleneck is not in the processors at all, adding more does not help. If the disk subsystem is maxed out, adding a processor does not increase work done. (If this isn't obvious to you, it's time to reread the beginning of this chapter.)
More subtle problems can occur. These all revolve around the contention for shared resources. The processes in the example above were selfish in the extreme: the only thing they shared was their code. Because code is only read and not written, each processor can have a copy of the code in its primary and secondary memory caches; as they execute they don't even have to share access to the RAM that holds the code. Programs frequently operate independently like this, but unlike this example they tend to use shared system resources and thus mutually develop bottlenecks as they contend for those resources.
Here's a different example that quickly illustrates the contention for shared resources. We again use our modified copy of Gdidemo that draws balls continuously on the screen. This program does minimal computation and maximal drawing. Because there is only one display subsystem, contention develops for resources surrounding writing on the display. We'll start eight copies of this program, one after the other, and see how they fare on the eight-processor computer. But let's be clear: eight-processor computers do not normally sit on a desktop and get used for drawing pictures. This is not something you'll normally do but it serves to illustrate the conflicts that can arise.
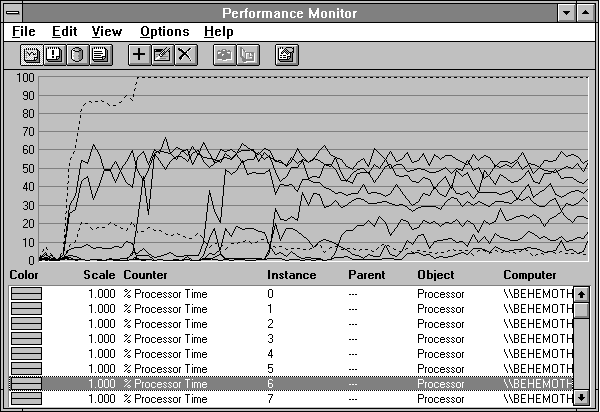
Figure 3.43 Resource contention by eight graphics programs on an eight-processor computer
Spaghetti? No, poetry! The thin black lines are the utilizations of the eight-processors. The high black dotted line is the processor utilization of CSRSS, the graphics subsystem process. The first program starts and two processors leap into action, with a third contributing a little effort, around 8 to 9%. When the second program starts, the third processor picks up considerably. Now CSRSS is using 100% of a processor. As each program gets going, another processor kicks in, although at decreasing utilization.
The next figure shows that by the time we have four drawing programs running, we have reached a firm bottleneck. The heavy black line is the System: % Total Processor Time. This is the aggregate sum of processor utilizations. By the time the third program starts, we are nearly maxed out. With the fourth program, it's the end of the line. The highlighted line is System: Context Switches/sec. This reaches a maximum (see value bar) of 14,256 switches per second. Because there is a context switch each time a program sends a batch of drawing commands to CSRSS, this is a pretty good measure of drawing throughput. It is not quite as jittery as the total processor utilization, and shows the bottleneck very clearly. After the fourth program, even though we are adding more processors, there is no more work getting done. Bottleneck defined. Once we get to this point we could add processors all day.
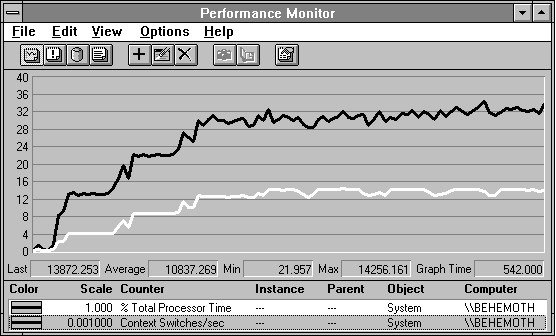
Figure 3.44 After the fourth process is added, no more work gets done
What is the cause of this bottleneck? CSRSS has to protect the common data structures that surround drawing on the display. This includes the video RAM itself which holds the drawn images for the display, but also numerous internal structures involved in drawing. Once these are 100% in use, we're at maximum throughput.
We noted that when the second drawing program started, CSRSS jumped to using 100% of a processor. Untrue. Actually, it is using more. On a multiprocessor computer, 100% is not really the maximum percentage of processor time that a process can have, but Performance Monitor artificially restricts the value to 100% anyway. It takes the meaning of "percent" a bit too literally. Are we embarrassed? A little. Will we survive? Probably. Anyway, to see how busy such a process really is on a multiprocessor system, you have to look at the utilization of processors by a process's individual threads. This we do in the next figure.
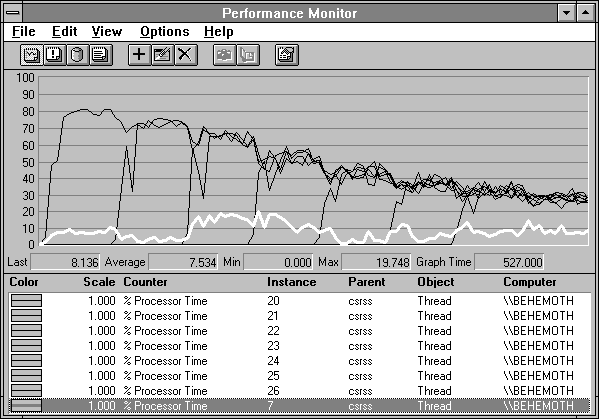
Figure 3.45 CSRSS threads with eight graphics programs and eight processors
This shows thread 7 highlighted and solves the minor mystery of who it was that used the 8 to 9% of a processor when we first started. This is a CSRSS housekeeping thread doing background work as a result of the primary activity.
Now when the second drawing program starts, we see two CSRSS threads equally active at about 72.5% processor utilization. That's almost 150% for the CSRSS process as a whole even if we ignore thread 7. We know the bottleneck is at four programs, and at that point the four CSRSS threads are at a little over 50% utilization, or 200% for CSRSS as a whole.
This shows that system hardware or software resource contention can lead to a bottleneck in a multiprocessor system. To understand what is going on you need knowledge of the application, the hardware, and the operating system. Unfortunately, there is no substitute for this knowledge. If you don't know what's going on inside, all guesses are equally poor.
Here is another example of how contention can arise in multiprocessor systems. This example is extreme but again illustrates the point nicely.
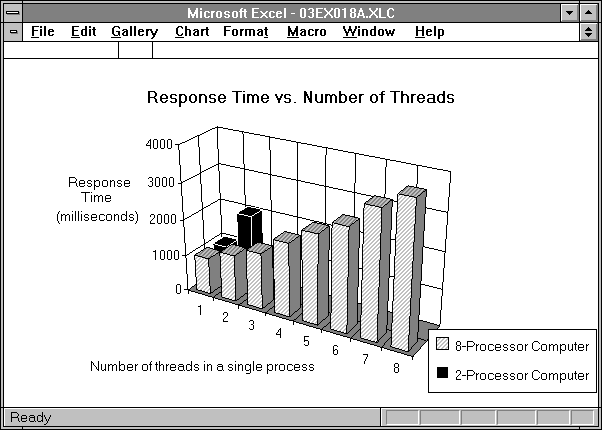
Figure 3.46 Memory contention in multiprocessor systems
This figure shows the output of Response Probe in two different computers: a two-processor system and an eight-processor system. Each thread of the probe is being asked to compute for one second, with no file or special memory activity, and to measure the time it takes to do that one second of computation. Remember that the number of instructions the probe needs to execute to use up a second of computation is determined by the main probe process before starting the child process that applies the load. This number is then communicated to its children.
In this experiment there is only one process. In successive trials, a thread is added to the process. The response time is observed each time.
In the first experiment in this section, we saw that eight probe processes doing this same workload got the same response time on eight processors as one process did. Here, this is not so. Each thread added slows the aggregate down. The response time grows. Moreover, it degrades more on the two-processor computer than on the eight-processor.
Why are the results for multiple threads in one process different from multiple threads in separate processes? Because they are in the same process, these threads are sharing the same address space. They are writing frequently to the same memory location. This is a big bummer for multiprocessor systems.
First let's take a brief look at how Response Probe works and the source of all this contention. Response Probe is basically in a loop trying to determine how much of what load to place next on the system. It uses a normal number generator to find out how much processor load is being requested. The normal number generator returns a number which, over a sequence of calls, will be normally distributed (on a bell-shaped curve) with the mean and standard deviation you supply (see Appendix C for details). Inside the processor load loop, Response Probe looks at where in the pseudo-code space the next read from "code" memory is to take place. Then it generates another normally distributed number and looks at where in its data space you want the next words to be written. This causes yet another call to the normal number generator. Each call to the normal number generator causes seven calls to a random number generator. And each call to the random number generator returns a random number which, as a side effect, is stored in a global cell of memory for use on the next call. This memory cell is the spot where all the contention takes place.
When a memory cell is written in a multiprocessor system, care must be taken to make sure that cell is kept consistent in the memory caches of each processor. This is done by the cache controller hardware in the multiprocessor computer. A number of algorithms can do this, and they vary in cost of implementation. The idea is the same in each, however: when a processor needs to write to memory, the hardware must determine whether that memory location is in the cache of some other processor(s). If so, the other caches must be invalidated (cheap solution) or given the new data (expensive solution).
At this point, the cache controller writing the data may update main memory so that other caches will get the updated data from memory if they need that word in the future; this is called write-through caching. Alternatively, the cache controller can wait to update main memory until it needs to reuse the cache location. This is called write-back. If the location is rewritten frequently, write-back caching obviously can cause fewer writes to main memory, and thus less contention on the memory bus. But if another cache needs the data (as is increasingly likely as we add threads in this case), it must have the logic to get the data from the other cache instead of from main memory. In this case, the original cache must listen in on bus requests and respond before main memory to requests for data which it has but which is not yet valid in main memory.
This is the briefest possible introduction to the rich and interesting topic of multiprocessor cache coherency. There are lots of schemes with varying tradeoffs in cost and performance. Obviously, two quite different schemes were used in the two-processor and the eight-processor computers measured here. In fact, we get no particular benefit from adding the second processor in the two-processor system for this test. That does not mean that this is a bad implementation of multiprocessors, although it is likely a cheap one. You need to keep in mind that this is an extreme example. The test of multiple drawing programs ran quite well on this two-processor computer, and because it was designed more to handle this sort of desktop application, all is well. But this example illustrates that the investment in more sophisticated hardware in the eight-processor system paid off in improved performance when memory contention is a big factor. It also shows that Response Probe is a pretty brutal test of cache coherency hardware designs.
It is quite difficult to see cache and memory contention with Performance Monitor because the conflicts are in hardware at a level where there are no counters visible. It just looks like the processors are busy. It is not possible to see that they are being stalled on cache and memory accesses. The only test that works is the addition of a processor and the observation of throughput or response time. And being sure the problem is cache/memory and not some other resource is also tricky. There is just no substitute for doing controlled experiments like those in this section to characterize the system. Alternatively, you can buy another processor and hope for the best.