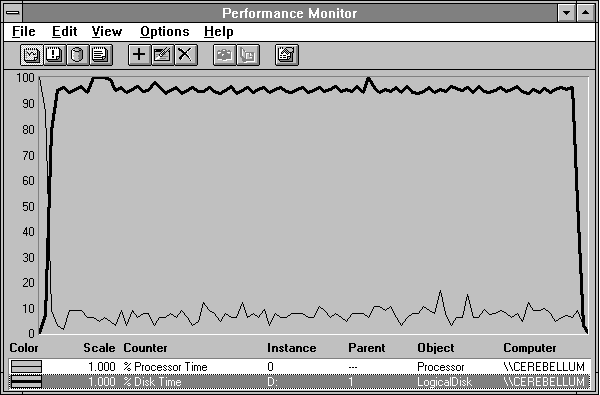
Let's take a look at the damage we inflict on a disk with the preceding Response Probe experiment. Naturally, we crank up Performance Monitor, and we'll set up Performance Monitor to write its log file on another disk, to minimize the interference it might cause.
Figure 4.2 shows Processor: % Processor Time as a thin black line, and Logical Disk: % Disk Time as a thick black line during the above experiment. To get this data, you must have installed diskperf, or the % Disk Time will remain at zero.
What is the difference between a physical disk and a logical disk? A physical disk is the unit number of a single physical disk unit, while a logical disk is the drive letter of a disk partition. (For example, a single disk drive with two partitions would be a single physical disk instance, such as 0, with two logical disk instances, such as C and D.) The parent instance of a logical disk is the unit number of the physical disk on which it resides.

Figure 4.2 Processor and disk behavior during disk bashing
One thing that is pretty clear is that the processor is no longer the bottleneck, and the disk certainly is. Boy, this is easy!
In Figure 4.3 we show a bit more detail about overall performance. Average Processor utilization is only 7.2%, but the interrupt rate is well above the 100 Interrupts/second we expect from the clock on an idle system isolated from the network. We see an additional 60.194 Interrupts/sec. Could they be from the disk? Let's find out.
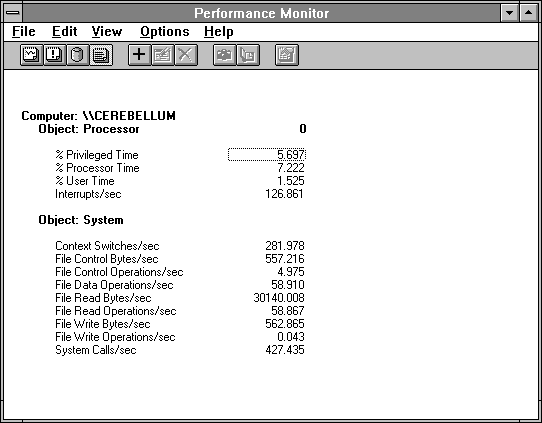
Figure 4.3 Processor and system activity when reading small records from disk
If we divide File Read Bytes/sec by File Reads/sec, we get 30140/58.867 = 512 bytes per read, which is what we told Response Probe to do, so this is good. Other than the elevated system call rate, the remainder of the System counters show a small amount of background activity, which we shall not explore further.
Figure 4.4 contrasts the activity on drive D, from which we are reading the 512 byte records, and the C drive, on which we are logging the Performance Monitor data. (We omitted the % Free Space and Free Megabytes counters because they don't play a role here.)
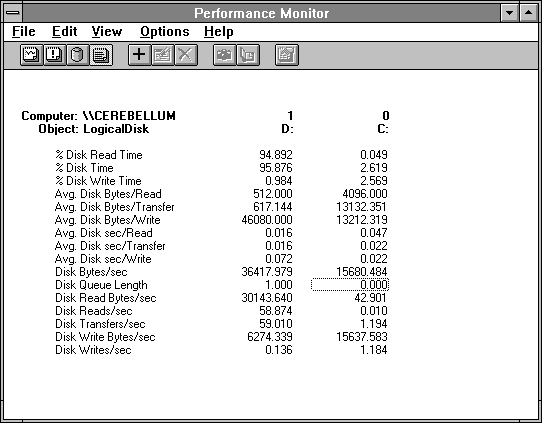
Figure 4.4 Disk activity while reading short records, logging elsewhere
Drive D is, basically, pegged to the wall and preoccupied with reading. Drive C is barely perturbed and focused on writing. What a grand study in contrasts! There's really quite a lot to look at here. In both cases, we see that % Disk Read Time and % Disk Write Time sum to % Disk Time. You might have expected this but it is not always true, as we will see shortly.
Remember the 60.194 extra interrupts discovered in Figure 4.3? If we add the Transfers/sec from Drive D and Drive C, we get 60.204. This is close enough that we should suspect more than a coincidence. Why aren't they identical? When collecting data, the system polls each object manager in turn for its statistics. Because the system is still running during this process, we might expect System counters to be off slightly from Disk counters. So now you know a new Rule.
Average Disk Bytes/Read on drive D are 512 as expected in this experiment. On drive D we see an Avg. Disk sec/Read of 0.016, quite near the 16.85 milliseconds observed by Response Probe in this case. This means Performance Monitor interferes with the experiment only 1.1% as measured by the time to do the 100 unbuffered disk reads. Because we were logging at a one-second time interval, this is impressively low.
This number of 0.016 Avg. Disk sec/Read is bothersome. Because the counters of average disk transfer times (such as Avg. Disk sec/Read) are rounded to the millisecond, some interesting details may be omitted. What can you do? Remember that the % Disk Read Time is 100 times the average number of milliseconds the disk was busy during a second. So we can eke out a few more digits of precision:
Avg. Disk sec/Read = % Disk Time / Disk Reads/sec = .94892 / 58.874 = 0.016118
So we were quite close to 16 milliseconds after all. There are times when it is worth checking. But a word of caution is definitely in order: this calculation only works when the queue length is one or less, as we see shortly.
Reversing our perspective for a moment, we see a very small Disk Writes/sec on drive D (0.136), but a very large Avg. Disk Bytes/Write (46080). We don't write very often, but when we do, it's a whopper! This gives an Avg. Disk sec/Write of 0.072 (72 milliseconds), much larger than the 0.016 Avg. Disk sec/Read. This activity is due to system directory maintenance. It's unclear whether this large 72 millisecond transfer time is due to the large transfer size or to the disk having to do a seek operation away from our experimental file. How could we find out? Construct a quick experiment to read 46080 bytes repeatedly.
Let's look into this a little further, because we sense another Rule about to emerge. Let's plot the Avg. Disk Bytes/Write on drive D and see what is happening here. Take a gander at Figure 4.5.
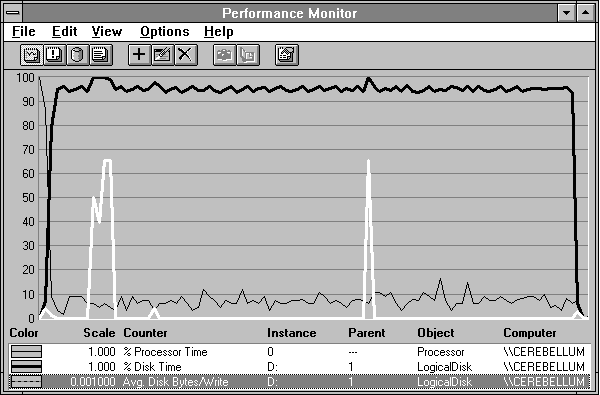
Figure 4.5 Background disk writing while reading short records
The 40K number reported in Figure 4.4 did not give us much of a clue. Now we can see that what is really happening here is that 65K writes are taking place, along with some smaller ones. The file system is updating its directory information during our experiment, and there's really no stopping it. This is not significant, as far as interference with our experiment goes. But the 40K number is a bit misleading, and the rate of 0.136 writes/sec contains no clue that this is really a few isolated large writes instead of a steady stream of writes of various sizes. Because Performance Monitor is built on lots of averages, it is wise to remember Rule # 10:

You can divide Disk Read Bytes/sec (30143.640) by Disk Reads/sec (58.874) to get the Avg. Disk Bytes/Read of 512.002. This differs from the 512.000 reported, because the reported numbers are truncated to 3 decimal digits. There's no point in getting bogged down in the fine printwhat's 0.002 bytes among friends?
There is an interesting difference between the data on drive D and that on drive C. Look at Figure 4.6, which isolates the issue.
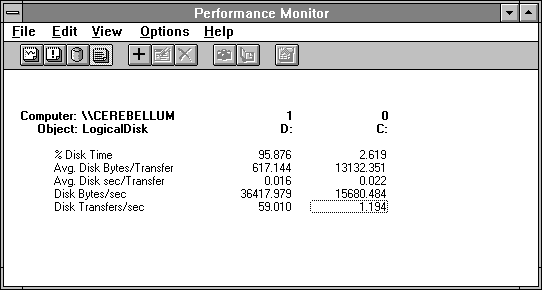
Figure 4.6 Study in contrasts: disk transfer rates
Drive D is 96% busy, doing 59 transfers and moving 36K a second. Drive C is 2.6% busy, doing 1.1 transfers a second, and still moving almost half as many bytes per second. Clearly drive C is operating more efficiently. The reason is that Drive C has a higher value for Avg. Disk Bytes/Transfer, 20 times higher. Yet each transfer is taking only 6 milliseconds more time. When you try to locate a disk bottleneck, after noting that the disk is busy, look at the average transfer size. It is a key to efficient use of the disk.
Looking again at Figure 4.4, the Disk Queue Length on drive D is 1. This is an instantaneous countjust the value at the endpoint of the time interval of the report. But the probability that there is someone in the disk queue is 95.876%, the same as the disk utilization. Unlike System: Processor Queue Length, the Disk Queue Length counter includes the request in service at the disk as well as any requests that are waiting. In fact, all the disk statistics are collected by the DISKPERF.SYS driver, which is located above the normal disk driver in the driver stack. When a file system request comes into DISKPERF.SYS, it gets a time stamp and is added to the queue count. Then it gets handed to the next level of driver. This may be a fault tolerant (software RAID) disk driver, or the "real" disk driver. Any processor cycles consumed by the drivers go into % Disk Time.
Given the low processor utilization shown in Figure 4.2, it seems obvious that we have plenty of spare horsepower to drive the queue length up. Let's get five processes to do the same experiment at once and see what happens to the disk statistics.
Figures 4.7 through 4.9 show five processes doing the same thing the one did above: unbuffered reading of 512 byte records from a small file. Figure 4.7 includes the Disk Queue Length, which varies between 4 and 5, depending on when we take the snapshot. The % Disk Time is now pegged to the max. Comparing Figures 4.3 and 4.8 shows they are remarkably similar.
We have chosen to use the System counters instead of the Processor counters in Figure 4.8, but because this is a single processor system the processor statistics for processor 0 are the same as those for the system overall. In a sense Figure 4.8 is the "correct" style, because if we had a multiprocessor system Figure 4.3 would be showing the data for just one of the processors. And yes, we have manually placed Total Interrupts/sec out of order to make comparing these two figures easier.
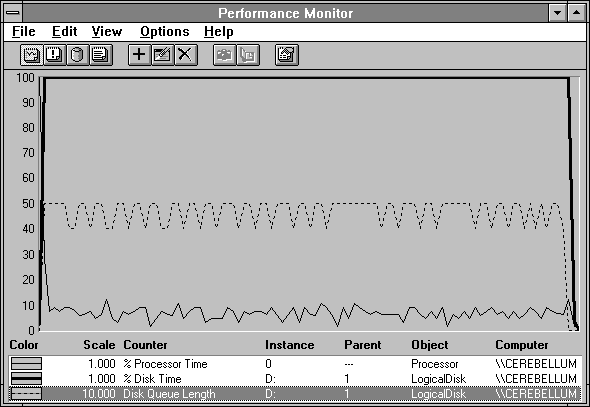
Figure 4.7 Five processes reading small records at once, or trying to
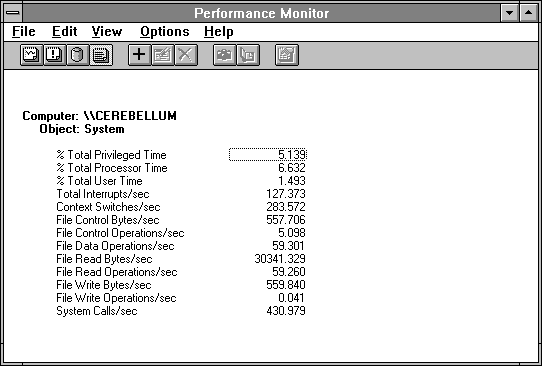
Figure 4.8 System overview of five processes reading small records at once
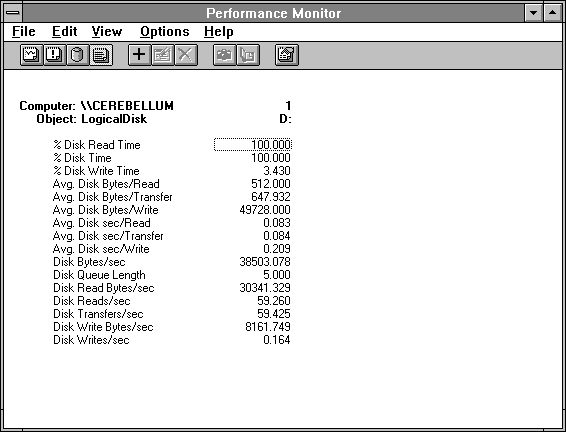
Figure 4.9 Disk behavior of five processes reading small records at once
But we digress. The main point here is that the statistics are nearly identical, even though we have added four more processes to the mix. But this should not surprise you. This is what we mean by the word bottleneck! The disk statistics don't change because the disk was already maxed out. All we have really done is dumped these poor processes into the disk queue. Figure 4.7 shows that this has taken up the remaining 4% slack in disk utilization, yielding about 1/2 more transfer per second.
So we see pretty much what we might expect in Figure 4.9, except for one thing. The sum of the % Disk Write Time and the % Disk Read Time exceed the % Disk Time. This is because DISKPERF.SYS begins timing a request when the request is delivered to the next driver layer. You can see this pretty clearly by comparing Avg. Disk sec/Read in Figure 4.9 to that in Figure 4.4. Let's use the trick we learned above to get a more accurate number for read transfer time:
Avg. Disk sec/Read = % Disk Time / Disk Reads/sec = 1 / 59.260 = 0.016875
Wow, this result of 16.875 milliseconds is very different from the Figure 4.9 Avg. Disk sec/Read of 0.083. What's going on? The 16.875 millisecond number is the time it is taking us to get each request from the disk. But the reported 0.083 number is the time spent in the queue plus the time to get the data from the disk. Dividing 0.083 by 0.016875 gives 4.9, which is an excellent measure of average queue length, and a better one than the instantaneous counter value Disk Queue Length.