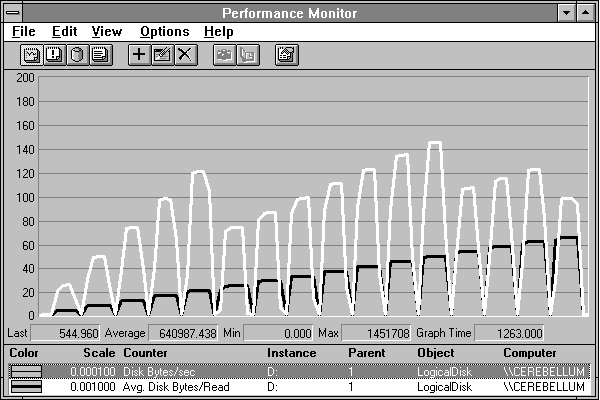
Let's try to discover the maximum rate at which we can get data from this disk. We'll read the same record over and over, increasing its size, until we maximize throughput. We'll read from the beginning of the file so we know we will be starting at the same point on the disk every time. We'll start by reading 1 page, and increase the size of the read 1 page at a time until the reads reach 64K. The results appear in Figure 4.14. The highlighted (white) line is the disk throughput in Disk Bytes/sec, while the black line is the size of the record that is read. This goes from 4096K per read (1 page) to 65536K per read (16 pages).

Figure 4.14 Transfer rates achieved by various-sized reads
Its not hard to see the highest transfer rate occurs in the case of 12-page records. As the size of the read operations grows, the transfer rate climbs, but something happens between the record size of 5 pages and that of 6 pages. Then it rises to a peak at 12 pages, and falls again for 13. It rises thereafter until the final fall at 16 pages. Very suspicious. Anyway, the maximum throughput we have achieved (see the value bar) is 1.4 MB per second. Finally, some decent throughput!
Now let this sink in: in this situation the disk is nearly 100% busy and transferring 1.4 MB/sec, while in Figure 4.2 the disk is nearly 100% busy and transferring 36K/sec. You may be able to tell how busy the disk is by looking at the utilization, but you don't know how much work it is doing unless you look at the transfer rate. In this respect, disk performance isn't that different from employee performance. We all have a coworker or three who is frantically busy all the time but doesn't get much actual work done. How hard a disk or person labors and how much they achieve are not always directly related.
The next figure shows pretty clearly why our transfer rates are not increasing monotonically.
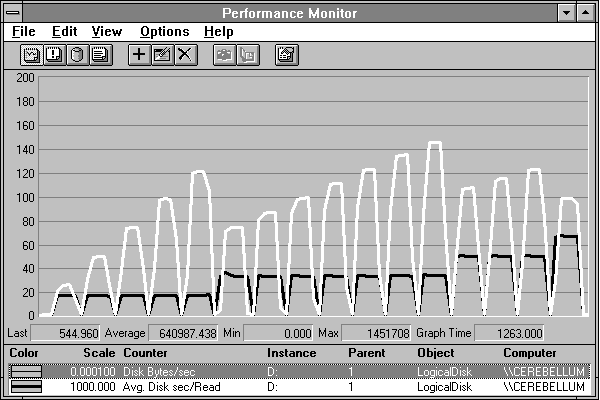
Figure 4.15 Transfer rates and transfer times achieved with various-sized reads
Aha! The transfer times are jumping just when the transfer rates fall off. And if you look closely you can see that they jump by 16.7 milliseconds each time. We've seen this number before, and here's why. Many disks rotate at 3600 rpm, or 60 revolutions per second. That's one revolution every 16.666 milliseconds. When we go from 5 to 6 page records, we suddenly need an extra revolution to read the entire record. This is quite damaging to our transfer rate.
The next two figures show the system overview and disk data for the read operation using 12-page records. We got this data by shrinking the time window to the case of interest, then viewing the report. The system data shows that all the bytes are going through the file system because we are unbuffered. The results are quite a contrast to those in Figure 4.3.
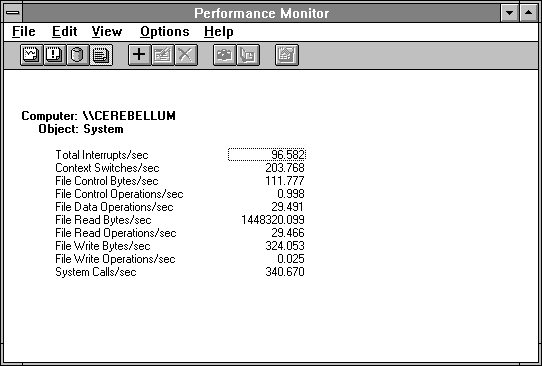
Figure 4.16 System overview during maximum disk throughput
The file statistics are just about as good as they get on this computer. Transfer size is exactly 48K per second, giving throughput of 1.4 MB per second. This puppy is hummin'!
But is this realistic? Recall that we are reading the same record over and over again, something we're not likely to see in the real world. Let's take another look at maximizing disk throughput, but this time let's use all of the 500 MB file we took so much time to create.
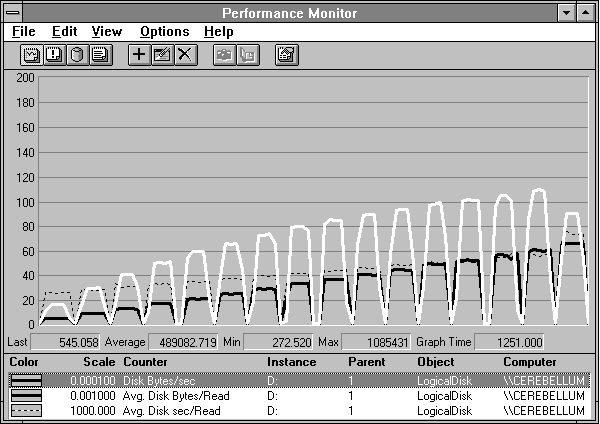
Figure 4.17 Randomly reading successively larger records of a 500-MB file
Now when we integrate seeking across the disk we see a linear increase in disk throughput as a function of record size, until we reach 64K. In this case, we lose another rotation every time, and throughput falls off accordingly. If we are not forcing a rereading of the same record over and over, we do not have to wait for the disk to rotate around to the start of the record each time. By accessing more randomly, the cost of the extra rotations that do occur is too small to notice.
In Figure 4.18 we narrow the time window to the case where throughput is maximum. Now we see all the data points collected during this time, and a slightly higher maximum is uncovered. If you really care about the details, be sure to narrow your time window to fewer than 100 data points so you don't skip any data points.
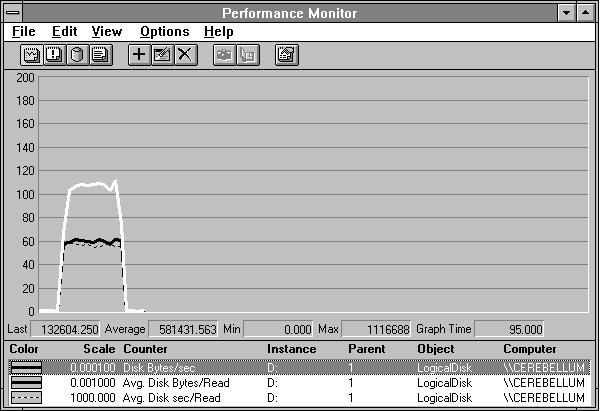
Figure 4.18 Narrowing down to the case of maximum throughput
Now we'll reveal a step we have been doing in many of these experiments, especially when we've shown you reports. This step is the further narrowing of the time window to include only the data of interest: the actual transfers themselves. If we fail to do this, the next few figures would include the end regions of Figure 4.18, and the averages would be lower. Worse, any instantaneous counters would show their idle values corresponding to the final data point in Figure 4.18. Always be careful to set the time window to include only the data of interest before looking at your detailed reports.
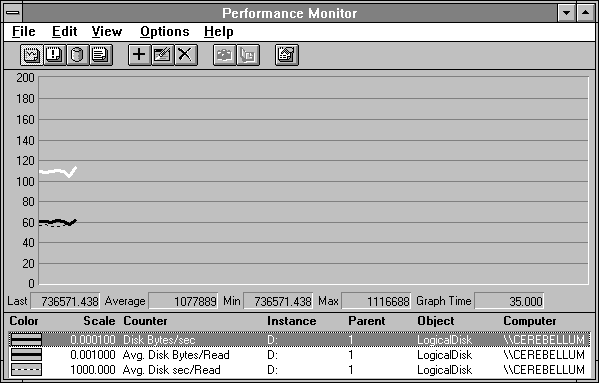
Figure 4.19 Setting the time window to exclude extraneous data points
Now we are set up to produce the usual detailed reports.
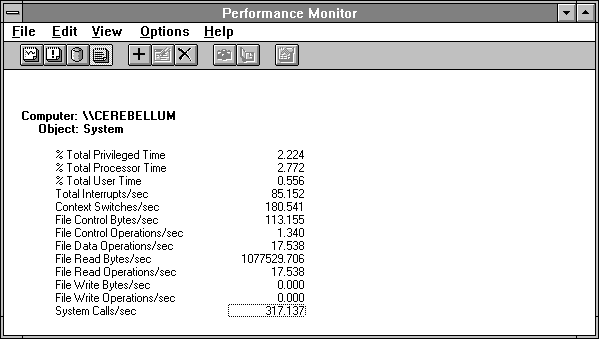
Figure 4.20 System overview reading across a 500-MB file with 60K records
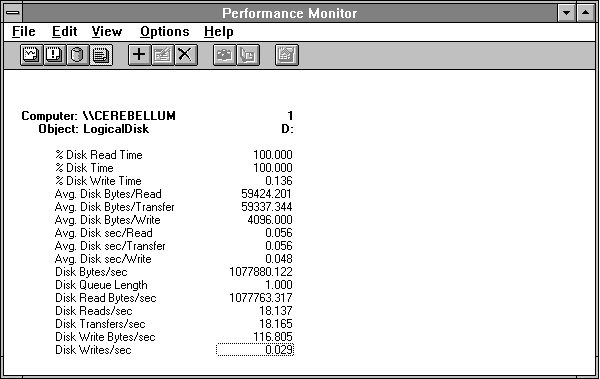
Figure 4.21 Disk statistics reading across a 500-MB file with 60K records
What do we learn from all this? This tells us that 56 milliseconds is a reasonable transfer time for large records with fairly substantial seek activity. Because Response Probe distributes access normally (a bell-shaped curve) across the 500 MB file, this might be considered an easier task than real random seek activity. We could repeat the experiment with real random seek activity, but by now you get the idea. You need to characterize the performance of your processor/disk adapter/drive subsystems in this sort of controlled fashion if you want to understand the bottlenecks on your systems. Response Probe permits the construction of a wide range of access patterns, as this and the previous example show. You can use these controlled experiments to understand observations from real-life systems.
Let's try one more experiment to make this point clear. We'll set up an experiment that does read operations in 60K chunks, but instead of distributing the read operations normally across the 500 MB, we'll distribute them randomly. We do this by increasing the standard deviation of the file seek position in Response Probe, making it equal to the mean. (Response Probe folds any attempts to access the disk beyond the end of the file back into the file. For more information on this, see Appendix C, "Using Response Probe.") The result of this change is displayed in Figure 4.22.
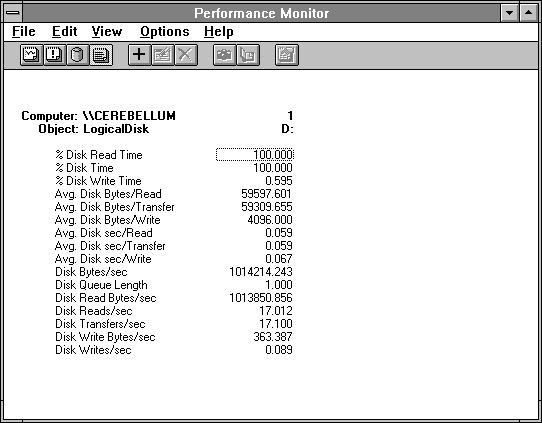
Figure 4.22 Disk behavior reading 60K records more randomly
The average time per read operation has gone from 56 to 59 milliseconds, and the throughput has fallen from about 1.08 MB per second to about 1.01 MB per second. That's a pretty substantial loss of throughput—about 6%. If we were to increase the file size, we would see more erosion in throughput as the disk spends more time seeking. Keep up this sort of nonsense, and you'll really know your disk!