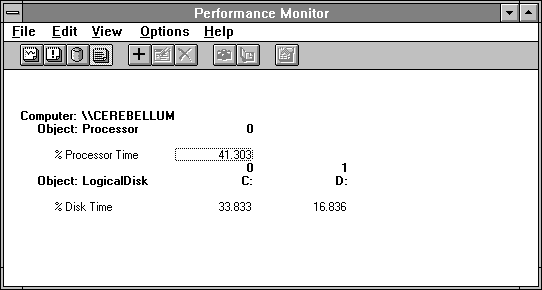
When we start Clock, it has to get into memory somehow (assuming it is not already there). When not in use, the program and those mondo fonts it uses are certainly better left on disk. Paging is the price we pay for being able to execute and address much more memory than will fit in RAM at one time. Usually, the price is quite reasonable, as in this case. Where is the bottleneck? Take a look at the next figure, where we've narrowed the time window to the three seconds of Clock startup activity.

Figure 5.13 Nested bottlenecks during the startup of Clock
The combined disk activity is 50.669%, while the processor is a close second at nearly 41.303%. The disk is the bottleneck. The system is fairly balanced, and if we got a faster disk subsystem we would quickly hit the processor bottleneck. We use 3 * 0.50669 = 1.520 seconds of disk time and 3 * 0.41303 = 1.239 seconds of processor time. The real elapsed time for Clock to start is the sum of these, or 2.759 seconds. A bit more than half of that is disk time. Paging has certainly cost us something here but we're not going to hit the boss up for a new disk drive to solve this particular bottleneck.
This is an important point. Paging is not inherently evil. It provides a very flexible system that uses memory in a reasonable way. It relieves the programmer of lots of memory management taskstasks which, if not performed carefully, can lead to unreliable programs that are difficult to maintain. But there are times when the computer simply does not have enough memory for all the necessary pages. Then we're in trouble.
Let's take a look at a more extreme case. We'll crank up the old Response Probe and start adding processes to the mix. We'll set up each one to write to one megabyte of memory in a bell-shaped distribution of references. This should give us some idea of what things look like when life is not so rosy. Figure 5.14 shows processor usage and page traffic during this experiment.
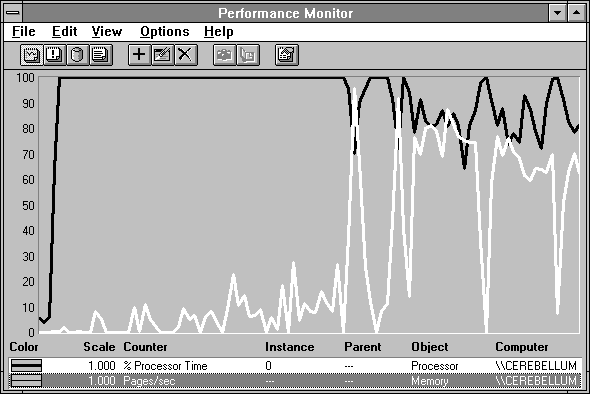
Figure 5.14 Processor usage and page traffic under increasing memory pressure
As the experiment proceeds, we see processor usage start to fall and Memory: Pages/sec start to rise. These trends are not even because if a process can get enough pages into memory to make some progress it will grab the processor and execute for a while. Overall, however, things are going from fine on the left to awful on the right.
But there's something else going on here which we should mention. On the right you can see some downward spikes in paging traffic. In the next figure we focus in on this section of activity.
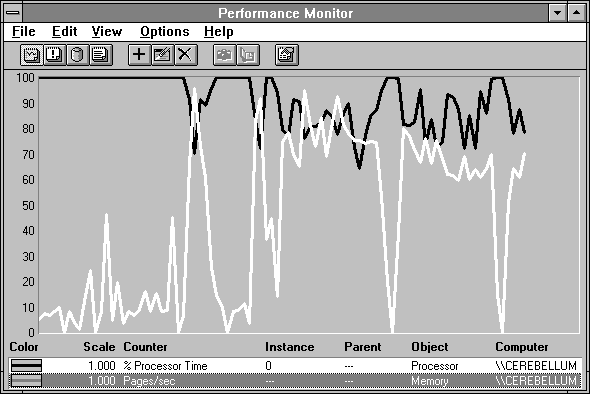
Figure 5.15 System usage at the onset of paging
The downward spikes in paging activity are accompanied by periods of full processor utilization. This is where a new copy of Response Probe is starting and calibrating the processor. Because this occurs at High Priority class, the other probe child processes are pretty much brought to a halt and their paging activity stops. When calibration completes, the child processes begin to compete for pages again.
In the next figure we show the working sets of these processes as they apply increasing pressure on the system. By the time the third process has entered the mix, it looks as though they are settling down at their desired working sets, which seem to be at about 1.2 MB. Things go pretty well until the eighth process enters the mix, and then they degrade badly. To the right of the chart some processes are being forced out of memory for a while, and others are taking over. If we let them fight it out they would equalize to some extent, but the fact is there is just not enough room for everybody. From the previous chart we see that Pages/sec winds up in the 70s for sustained periods; that's just about as fast as this machine can execute page transfer.
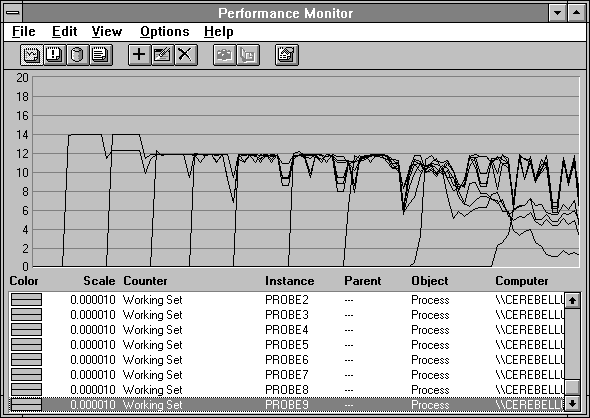
Figure 5.16 Response Probe working sets as memory pressure increases
We need to focus on some of the activity on the right of the chart and look at the Memory object data that indicates excessive paging.
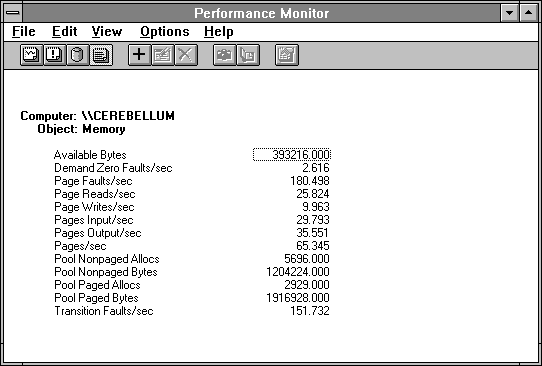
Figure 5.17 Memory statistics when paging is excessive
We've already said that Pages/sec is a key indicator and here we see 65 per second moving to and from the disk. Paging rates like this, when not due to file activity, are more than a system can sustain and still perform well. Available Bytes are down to 400K. Because the memory manager likes this number to hover in the 4-MB range, this is another indicator that we are extremely short of memory.
There are 180 Page Faults per second. Notice that there are 151 Transition Faults per second. This means that most of the page faults are being resolved by retrieving a transition pagea page that is in memory but is being written to disk to update the disk copy at the time of the fault. Why does this happen here?
Each probe process writes to a 1 MB data space with a normal distribution of references. As the memory manager attempts to retrieve space from the probe processes, it trims some pages from their working sets and, because the pages are dirty, the memory manager puts them on the modified page list. Because memory is so tight, it starts to write them to disk right away in hopes of freeing the frames holding them and satisfying the backlog of page faults. Once a write starts on a page it becomes a transition page. But the probe processes quickly re-reference many of the pages, because the bell-shaped reference pattern causes many pages in the middle of the curve to be touched repeatedly. A re-reference of such a page causes a page fault, because the page was trimmed from the working set. The page is found by the memory manager on the transition list, and replaced in the process's working set. The disk write process may stop if caught in time; in this case, most of them are caught in time, as we'll see shortly. This is why the modified page writer tries to delay the writes, so it doesn't have to rewrite the pages, but when there is so little free memory it has no chance to delay. It must write pages to free up space as quickly as possible.
Of the 180 Page Faults/sec, 151 are satisfied by these Transition Faults/sec, and 29 of them are satisfied by Pages Input/sec. This is close enough to count in horseshoes and bottleneck detection.
The demand zero faults come from the startup of new processes which require new cleared memory pages for their stacks and global data areas. These are satisfied by finding free page frames and filling them with zeros. We see that Page Reads/sec and Pages Input/sec are about equal, which means the memory manager is not having much luck bringing in multiple pages on a page fault. On the output side, however, the Page Writes/sec of 9.9 is causing Pages Output/sec of 35.5, or about 3.5 pages on each page write.