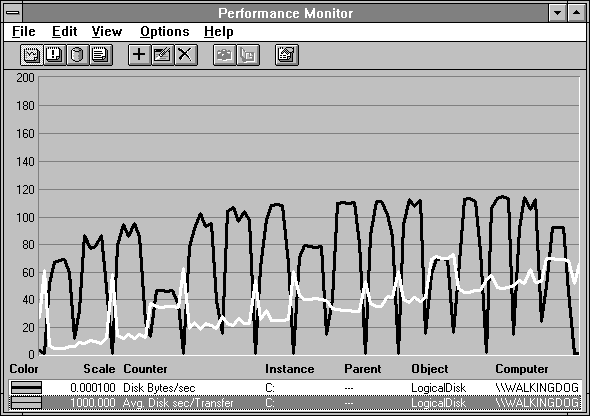
The experiments in this chapter were done on a 386SX/25 laptop with 12 MB RAM and a 120-MB hard drive. The first thing we do is see how the disk performs.

Figure 6.2 Disk performance of an example 386SX/25 laptop
Hey, that's not bad performance for a carry-on.
Let's take a quick look at why we might want to use caching in the first place. We'll do some tests, and run clearmem before each trial to make sure the cache is clear of file data before the test begins. In the first, we'll read a 1 MB file sequentially using 4096 byte records. In the second, we'll write the same file sequentially. (When Response Probe reaches the end of the file while doing sequential disk access, it restarts at the beginning.) In the third test, we'll read the file randomly with our usual bell-shaped normal distribution. In the last we'll read a record under normal distribution, and then write that record. In the next table we see the results of these tests, expressed as the response time to do one file operation of the type specified.
Table 6.1 Cached vs. Non-cached File I/O Times in Milliseconds per Record
Type of file access | Operation | Non-cached time | Cached time |
Sequential | Read | 6.58 | 1.32 |
Sequential | Write | 22.91 | 1.70 |
Random | Read | 20.45 | 1.51 |
Random | Read/Write | 40.66 | 3.16 |
|
Okay, you were probably convinced anyway, but now we know for sure. Caching is good for performance.
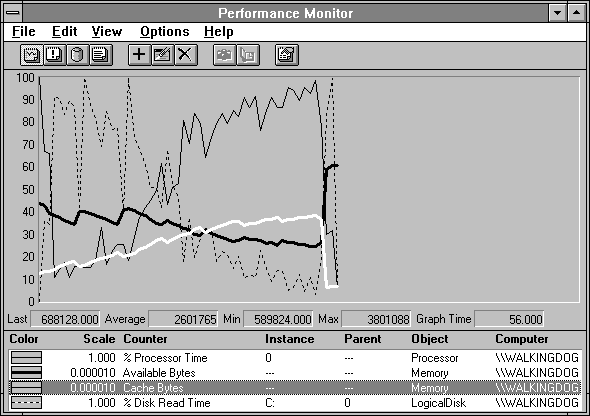
So now let's take a look at what's going on inside. We'll create a 10 MB file and we'll read from it 8192 byte records spread over about 4 MB in the middle of the file in, you guessed it, a normal distribution. The following picture emerges.

Figure 6.3 System behavior during cached reading of a large file
At the beginning, the processor utilization goes way down and the disk utilization goes way up, while the cache (highlighted in white) grows. When the cache gets to about 3 MB, the disk and processor utilization lines cross, disk activity drops off, and the processor activity picks up.
The dark black line is Memory: Available Bytes. There is meaning behind the sawtooth in this line. When Available Bytes drops below 4 MB, the memory manager wanders about the system trimming working sets in the off chance that some pages are not in active use. You can see the cache is also trimmed. Available Bytes jumps as a result of the trimmed pages becoming available. The cache quickly recovers its trimmed pages because they are in active use. It continues to expand and takes more of the Available Bytes as it does. As the cache settles to its necessary size, it has suppressed Available Bytes to about 2.75 MB, and the system stabilizes here until the experiment ends.
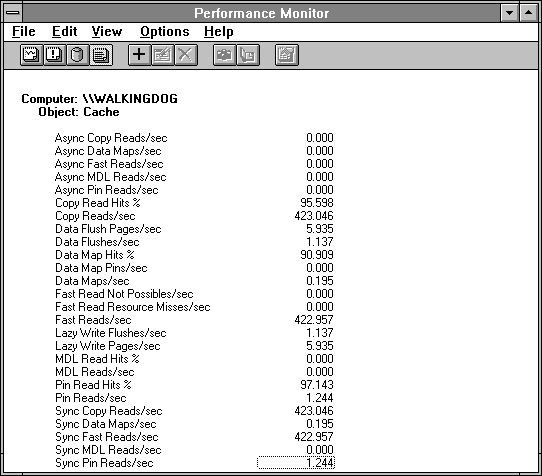
The next figure shows the cache statistics for this test case. Starting at the top, the asynchronous counters show activity for asynchronous I/O requests (you could have guessed that, right?). When it does asynchronous I/O, an application fires off a file request and keeps on processing other stuff, checking the status of an event to determine completion of the request. This permits applications to overlap file operations with each other and with other processing. This could also be done by assigning a separate thread to handle the file operation, but that is quite expensive in terms of memory used compared to asynchronous I/O. Many applications do synchronous file operations, in which case the application waits until input data is available.

Figure 6.4 Cache statistics during the reading of a large file
The first counter with activity is the hit ratio for copy reads, Copy Read Hits %. This is the normal file system read. It causes data to be copied from the cache to the application buffer. A hit occurs when a request is made by the file system for data and the data is already in the cache. We see a high hit rate and an impressive number of operations per second. We'll take another look at this.
There is a little bit of file output activity, indicated by the two Data Flush counters monitoring cache output. Data flushing occurs when the cache manager is told to make room by writing some modified pages out to the peripheral(s). There are a number of code paths that can trigger a data flush:
All of these actions call the data flush operation, which in turn invokes a memory manager routine to build an output request for the file system to actually place the data onto the peripheral(s). By the way, it's Performance Monitor that is writing the data here. Heisenberg in a laptop!
Look at the high percentage of Data Map Hits. Wow, what a great cache hit rate! Wrong! True enough, the hit rate is high, but the operation count as measured by Data Maps/sec is small. It is very important to watch the operation counts when trying to interpret the hit rates. Data maps are used to map in file system meta-data such as directories, the File Allocation Table in the FAT file system, Fnodes in HPFS, or the Master File Table in NTFS. If this count is high, you are burdened with directory operations and the like. This may indicate the copying of many small files, for example. You'll see Data Map Pins when the mapped data is pinned in memory preparatory to writing it, indicating the system is making changes to file system data structures.
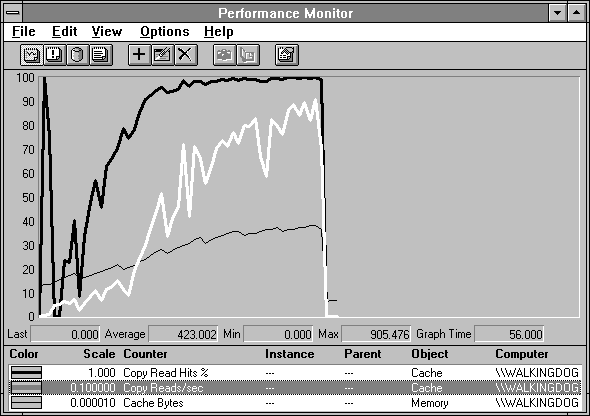
To emphasize the importance of looking at both the hit rate and the operation frequency, in the next figure we illustrate the relationship between Copy Read Hits % and Copy Reads/sec. On the far left there is a spike in Copy Read Hits % but the low operation rate renders this unimportant. Then, as the cache grows in size to accommodate the file, the counters rise together. The result is the lower disk traffic and better processor utilization numbers seen on the right half of Figure 6.3.

Figure 6.5 Copy Read Hits % and Copy Reads/Sec during reading of a large file
We mentioned in an earlier chapter that Fast Reads are the I/O manager look-aside mechanism which can bypass the file system and obtain data directly from the cache. Ideally, most application file requests are handled in this fashion because it is very efficient.
A multiple data list (MDL) request is a way for a file system to deliver large blocks of cache data using direct memory access (DMA). The MDL provides a physical memory address for each page involved in the transfer. The Windows NT server process sometimes uses this method for large transfers of data from cache.
In a Pin Reads operation, the cache is reading data with the objective of writing it. To do the write to a partial page, the cache must first read the entire page off the peripheral. The page is "pinned" in memory until the write takes place. The hits occur when the data is already in the cache at the time of the read request. Because of pinning, writes always hit the cache, or else go into new page frames materialized for the purpose when written to new space.
The Sync counters exist just to break out which requests are synchronous versus which ones are asynchronous, as described previously. This breakdown is not going to be of vital concern to you often. If you have a lot of cache activity and you have an application mix that uses these two different access modes, the hit rates of the two might give you a clue as to which applications were hitting the cache and which were missing. Usually your powerful server application will be using asynchronous file access to get the best concurrency for the least system cost, and you will be able to determine if that application is the one that is getting the cache hits (or misses).
The upshot of all this is that for normal file read operations you watch Copy Read counters to judge activity. For normal file write operations you watch the Data Flush counters to judge activity. Data Map operations generally indicate directory activity, or activity on lots of files. It's really not as complicated as it looks.