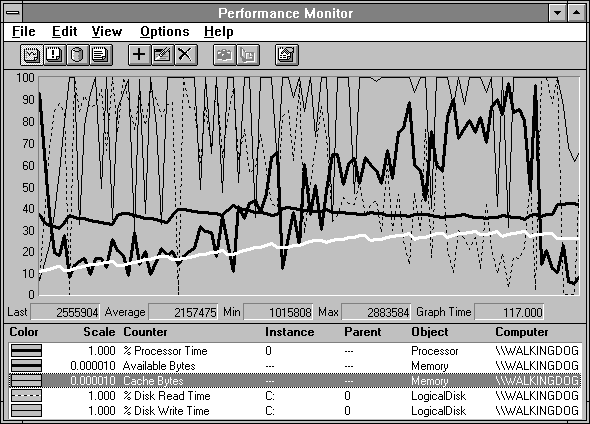
So much for sequential file processing, now that we understand its cache behavior better than we ever wanted to. Let's look at how the cache behaves when we access about 3 MB of this file with a normal distribution, first reading a 4096 byte record and then writing it. This wreaks the havoc shown in Figure 6.13.

Figure 6.13 Havoc reigns over random read/writing
The scary thing is that Figure 6.13 might make sense to you now. The highlighted line is Memory: Cache Bytes and we see the cache growing as the test case proceeds. The dotted line is % Disk Read Time. It starts out at a quite busy level and, as the cache is filled with data, it drops off. The thin black line is % Disk Write Time. It spends more time near 100% as the cache is filled with data. This is because the less time we spend going to disk to read the data (because it is in the cache), the more rapidly we write the records, and the more output activity we create. The heavy black line measuring % Processor Time increases steadily as we fill the cache and we wait less for the disk. The other heavy black line measuring Available Bytes stays relatively level, indicating the cache is getting its new space from inactive working sets, as shown in the next chart.
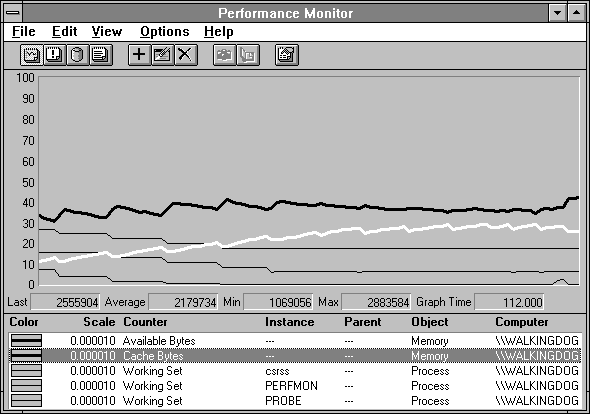
Figure 6.14 The cache steals much needed pages from other working sets
In Figure 6.14 it is clear where the cache is getting its space. You can see that each time space is trimmed from the working sets, it is added to Available Bytes. The CSRSS working set is reduced in size until it is held by the memory manager at about 2 MB to assure some screen responsiveness. The working set of Performance Monitor is reduced until it reaches the level it needs to maintain logging. The working set is trimmed a bit too far, and you can see a little blip where a few pages are retrieved (by a soft fault) back into the working set. Pages trimmed after that are immediately retrieved so we see no further trimming. The Probe process is the master process controlling Response Probe, and is inactive during the test, so it completely loses its page allocation. We see the process wake up and bring them back in (causing page faults) at the end of the test on the right of the chart.
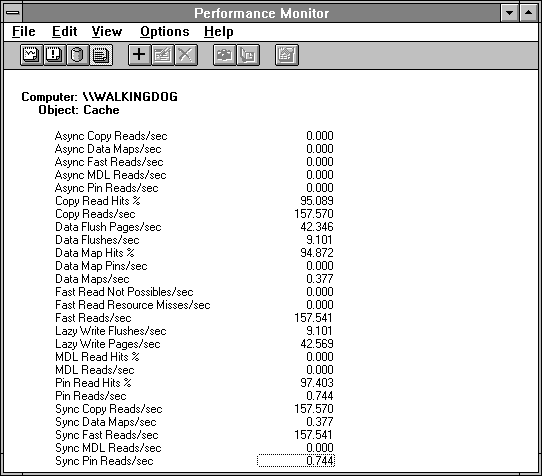
Figure 6.15 Cache statistics for normally distributed read/writing
The next two figures display cache statistics. We see a lower Copy Reads/sec in this case than during sequential reading, because the cache manager can anticipate sequential read requests more effectively than this normal distribution. Figure 6.15 is also a strong exemplar of the 10th Rule of Bottleneck Detection: Averages reveal basic truths while hiding important details. Figure 6.16 shows why.
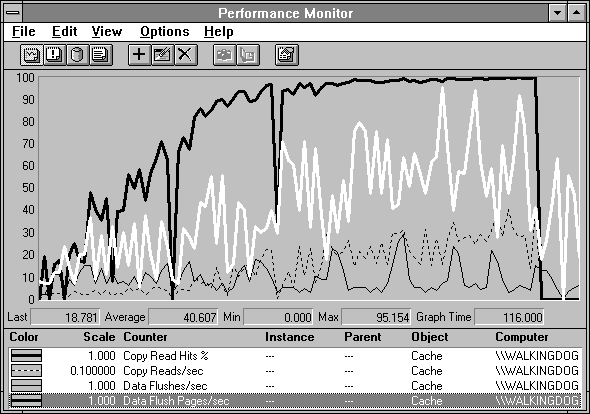
Figure 6.16 Cache statistics during normally-distributed reading and writing
Here we can see the heavy black line of the Copy Read Hits % rising nicely as the experiment progresses. The Copy Reads/sec starts out quite low, but rises as the hit rate improves. Likewise, the Data Flush Pages/sec (in white) rises on the right side of the chart. They also continue beyond the end of the experiment as the lazy writer clears the cache of dirty data.
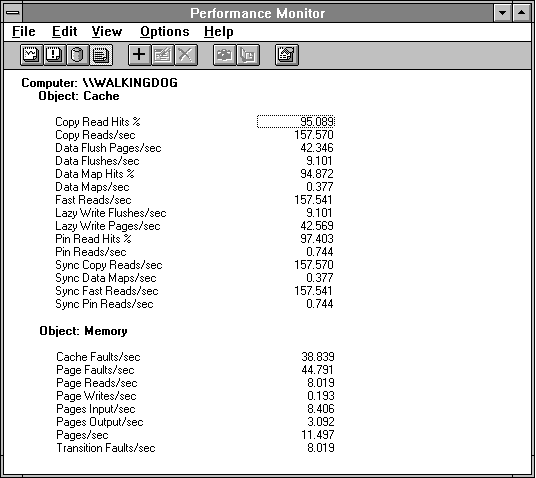
Figure 6.17 Memory manager and cache during normally-distributed reading and writing
Figure 6.17 shows how the memory manager's statistics compare to those of the cache. Cache Faults/sec are a subset of the Page Faults/sec. You can tell the bulk of the memory management activity is due to the cache activity because the Cache Faults/sec at 38.8 account for most of the 44.8 Page Faults/sec. Obviously, quite a few of these are soft faults, because the number of Page Reads/sec is only 8.0. Furthermore, we can see the lack of sequentiality in the read operation because there are 8.4 Pages Input/sec. Not many pages are being acquired on each read.
Looking at the output side, because Data Flush Pages/sec is at 42.3 and Pages Output/sec is at 3.1, the cache is clearly doing almost all the output. In fact, we have seen this pattern before: because Page Writes/sec is only 0.2 and Pages Output/sec is 3.1, there are really 3.1/0.2 or 15.5 pages written on each memory management output. The memory manager is getting in there and occasionally trimming working sets again, and getting almost 16 pages to write each time to disk.
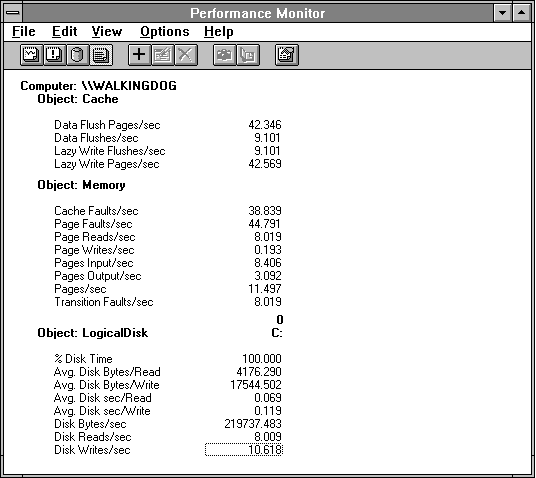
Figure 6.18 Disk statistics during normally-distributed reading and writing
Disk statistics for this test are illustrated in Figure 6.18. Notice the relatively long Avg. Disk sec/Write. Hey, it's just a laptop, remember? But looking back to Figure 6.2, when we characterized the disk speed by reading a single record, we can see that simple read time is not bad. Looks like it's seeking that slowed us down here. In the design of this laptop, the manufacturer made a tradeoff to seek a little less quickly than on desktop systems. Just think of all those extra hours of battery life they got in return for this decision!