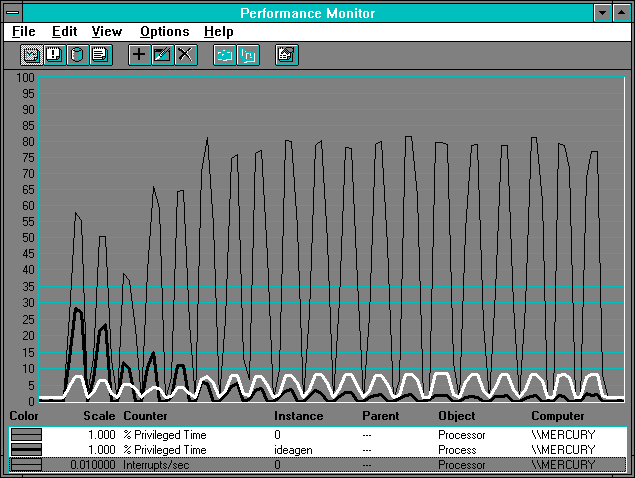
This is all well and good, but we don't yet know who is really using all that processor time. We can see that it is used, but we can't see it all in any process. The answer is in the high interrupt rates observed during network or serial data communications activity. Time in interrupts is not billed to the thread or process that is running, but it is counted in overall processor usage. When there are lots of interrupts, this can grow to be the majority of the Processor: % Processor Time. In the following figure we show the relationship between overall processor usage and time in the user process, as well as interrupt rate. Since most of the time is in privileged mode, we can chart privileged mode time, and thus avoid some annoying user mode spikes caused by the Response Probe calibration.

Figure 7.7 Processor usage on the client side while reading
We see the Ideagen privileged mode processor time (thick black line) fall off as the record size increases. But overall processor utilization increases. We can conclude from this that we are spending more and more time in each interrupt. Why? The larger records must be copied to Ideagen's buffer, and this is done at interrupt time. As the average transmission size increases, so does the amount of time in the client's interrupt handler. The Interrupts/sec declines slightly until we start doing the large read protocol, at which time it levels off. Now let's take a look at the server to see what's happening there.

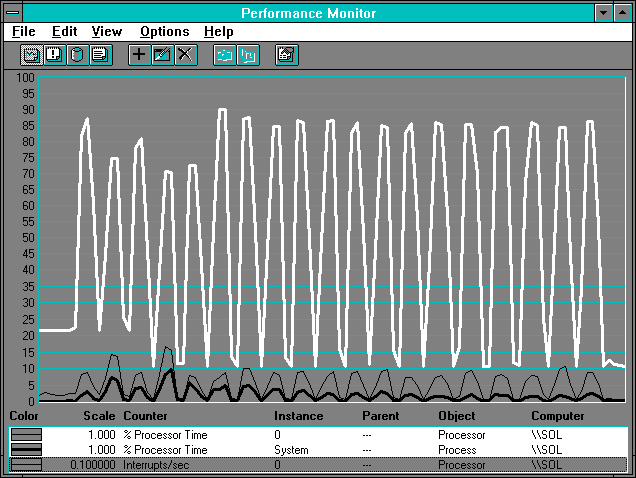
Figure 7.8 Processor usage on the server during client reads
In this chart we changed the scale factor for Interrupts/sec to 0.1 from the default value of 0.01, or it would have blocked the % Processor Time line. ? Qualitatively, the picture is similar to the picture of the client side; more work in the interrupt handler when the records are longer. But especially at the larger transfer sizes, the work split is not quite so dramatic.
Where is the bottleneck here? The definition of bottleneck is the device with the most demand during the interaction. In this case, the bottleneck is the client processor with 0.0019267 seconds per interaction. It is not, however, utilized 100%, but only 37.678%.
Why? Its activity is in sequence with the media, the adapter cards, and the server. Sequencing is an important limitation on the utilization rate of hardware components. When devices operate in sequence, they cannot be fully utilized. Or, looking at it another way, 37.678% is in this case fully utilized if the other devices are held constant, because the other two devices take 1 - 0.37678 = 0.62322 seconds out of every second. And until they finish, the client is in a forced idle state. When there is sequencing, the bottleneck is still the device with the greatest demand. Making one of the other devices faster can improve throughput, but to a lesser degree than improving the bottlenecking device.