Stay with us for a moment longer and we'll get the rest of this network bottleneck detection sorted out. Let's take a look at those interrupt rates. Let's assume for a moment that the interrupts always occur when the processor is idle. This is not a good assumption in all cases, but it mostly holds in this experiment.
On the server side we have total processor utilization of 7.950%, and processor utilization by the System process of 3.550%. Subtracting the utilization by the server process from the total processor utilization tells us that the interrupts took 0.04400 seconds. When the system is at rest logging at 5-second intervals, the interrupt overhead is negligible. So let's subtract the at-rest interrupt rate of 106 interrupts/sec on the server from the interrupt rate of 795.779, giving 689.779 interrupts/sec due to the experimental activity. Since there were 689.779 interrupts per second, we can divide 0.04400 by this amount and get 0.000063789 seconds, or 63.789 microseconds per interrupt.
On the client side we saw 37.678% processor utilization with 11.200% in the Ideagen process, giving us 0.26478 seconds of interrupt time. Again subtracting an at rest interrupt rate of 114 from 512.141 gives 398.141 interrupts per second from the experiment. Dividing 0.26478 seconds of interrupt time by 398.141 client Interrupts/sec gives us 665.051 microseconds per interrupt. The reason this is so much larger is because on the client side the data must be copied to the application's buffer, whereas on the server side the data can be read onto the network directly from the file system cache. They are also different processors, which is something we want to revisit in a moment.
It's worth mentioning that most of this interrupt time does not actually occur in the interrupt handler itself. That would delay lower-priority interrupts for a prohibitively long period of time. The Windows NT interrupt architecture permits the bulk of work normally done in an interrupt handler to be handled instead at a level just between interrupts and threads called the deferred procedure call or DPC level. The interrupt handler puts into a queue a DPC packet that describes the work to be done and then exits. When there are no more interrupts to service, the system looks for DPCs to execute. A DPC executes below interrupt priority and thus permits other interrupts to occur. No thread executes any code until all the pending DPCs execute. This design gives Windows NT an extremely responsive interrupt system capable of very high interrupt rates.
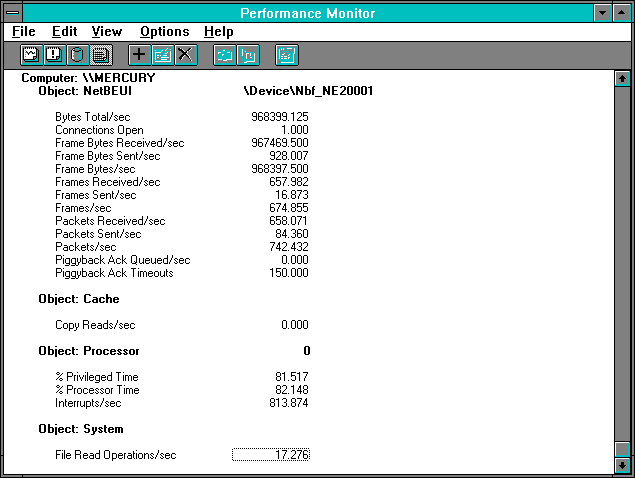
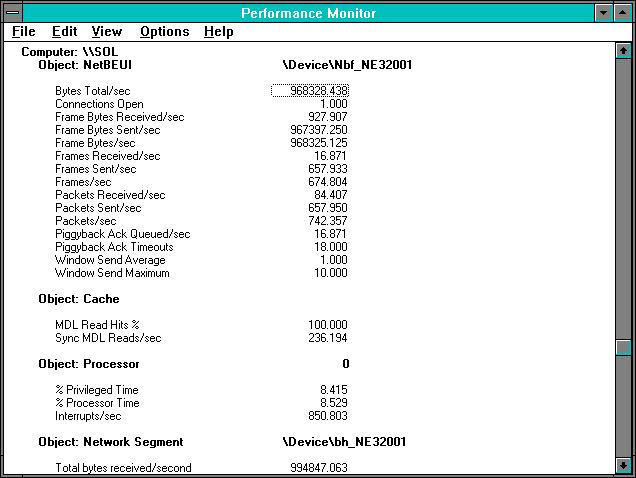
Let's now take a look at a case on the right hand side of Figure 7.1 and see how the result changes. We've chosen the 14-page transfer because it is in fact the one with the greatest throughput, although all the cases on that side of Figure 7.1 are pretty near the maximum.

Figure 7.9 Client's view of 14-page reads

Figure 7.10 Server's view of 14-page reads
Looking at client File Read Operations/sec, we are getting 17.276 reads per second. The inverse, which is the time per read, is therefore 0.05788 seconds. Can we account for the time?
On the server side we are using 8.529% of the processor, so dividing this by the client's File Read Operations/sec gives us 0.004937 seconds per read. On the client we are using 82.148% of the processor or 0.04755 seconds per read. Accounting for the network media, we divide the Network Segment: Bytes Total/sec by 17.276 to get 57585 bytes per read, which is only 241 bytes over the 57344 requested per read. (You might recall that at 12K we saw a shift to a more efficient protocol for large transfers.) And multiplying 57585 by the Ethernet transmission time we mentioned previously gives 0.046068 seconds per read. The adapters should now account for .012488 seconds each if we use the formula we derived for adapter overhead in the last example. Adding client, server, and media gives 0.123523 seconds.
Whoops. This is much larger than the time per read of 0.05788 we computed by simply inverting the read time. Why? Our more efficient protocol combined with the fact that we have many packets per read is now permitting an overlap of processing time on the server with transmission and processing time on the client. The data transfer is now broken up into 657.933 / 17.276 = 38.08 frames. (Be generous, invoke Rule #9, and call it 38 frames.) And 57585 / 38.08 = 1512, just two bytes short of the maximum Ethernet packet size. So transmission of these frames on the server is overlapping with receipt on the client side using a very efficient protocol.
Now let's take a look at how this larger transfer size affects time per interrupt. Continue to assume the interrupts occur when the server and Ideagen processes are idle, although the assumption is becoming dubious. On the server, we see 850.803 interrupts per second. We should subtract the at-rest interrupt rate of 106/sec, giving 744.803 interrupts/sec due to the transfer. Knowing we are using 8.529% of the processor, and subtracting 1.604% spent in the System process (not shown), gives us 6.925% in the interrupts. Dividing that number by interrupts per second gives us 0.00009298 seconds, or 92.98 microseconds. This is almost 50% more than the 63.789 microseconds for the time per server interrupt during the 2048-byte transfer.
On the client side we have 82.148% of the processor with only 1.774 % of the processor time in Ideagen (not shown). This means 0.80374seconds of each second are in the interrupt handler. Since the client is seeing 813.874 - 114 or 699.874 interrupts per second from the experimental activity, the same calculation that we performed for the server side gives us 0.0011484, or 1.148 milliseconds/interrupt. This is almost double the 665.051 microseconds per interrupt we saw in the 2048-byte case. In addition there are almost twice as many interrupts per second in the 14-page case.
As these cases illustrate, there is no "good" or "bad" interrupt rate or time per interrupt. By now it should be obvious: in order to understand the performance counters of your various systems in real working situations, you must first establish a clear picture of their operating characteristics under these types of pure workloads.