Up to now we have looked at some pretty simplistic stuff. Now let's add some serious server disk activity. Let's get Response Probe to read a large file, say 40 MB, using the normal distribution on 512-byte records to span the file. The reason we choose this file size is that our server has 32 MB of RAM and we would like to keep the experiment from fitting the whole file into the file system cache in RAM.

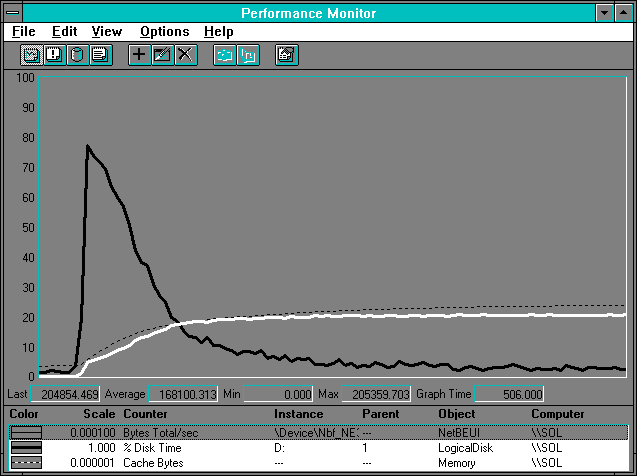
Figure 7.21 Server activity while reading a large file
The heavy black line shows the % Disk Read Time, while the highlighted white line shows NetBEUI: Bytes Total/sec. At the left of the figure, the disk is quite busy, but as the cache (the dotted line) fills, the disk activity falls off and the NetBEUI: Bytes Total/sec rises parallel to the increase in cache size to a maximum near 205,000 bytes per second. Referring to Figure 7.1, we can see the 512-byte read case gives a maximum of about 206,000 bytes per second. Disk activity never quite dies out, but it does taper off as the cache fills with the center records of the file where the normally distributed access is concentrated.
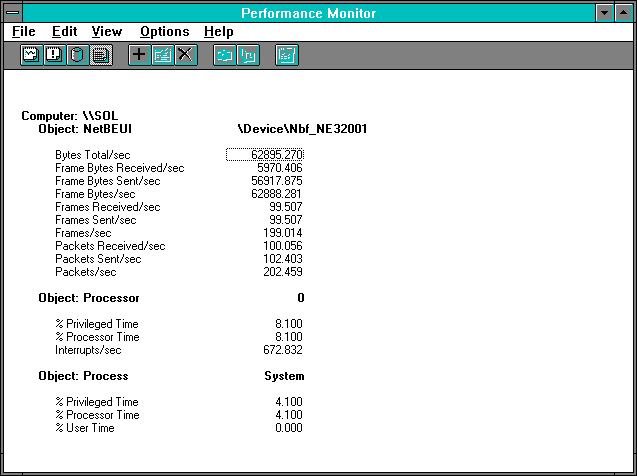
Let's focus on the 20 second period of heavy disk usage on the left of the chart. The next two figures display the statistics during this phase.

Figure 7.22 NetBEUI view of disk access on the server
We are getting only one-third of the NetBEUI throughput possible at this record size from this client. The processor is not very busy, and the interrupt rate is moderate.

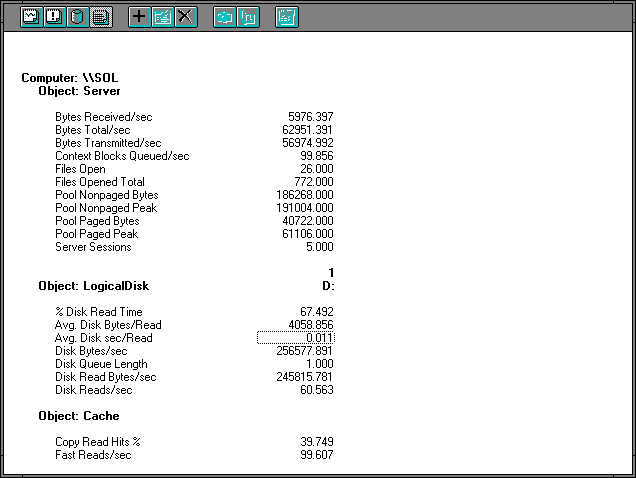
Figure 7.23 Server and disk view of disk access on the server
We can see that every record goes through the cache (NetBEUI: Frames Received/sec = Cache: Fast Reads/sec). The cache hit rate is 39.749%. So the miss fraction is 0.60251, and 0.60251 times the Cache: Fast Reads/sec rate gives us 60.014, which is within Rule #9 of Disk Reads/sec. In other words, when we miss the cache we go to disk. This is not a surprise. We are getting full pages off the disk, and we can tell we are reading randomly because the memory manager cannot find any opportunity to do sequential input. Let's take a quick look at the memory manager's statistics, too.

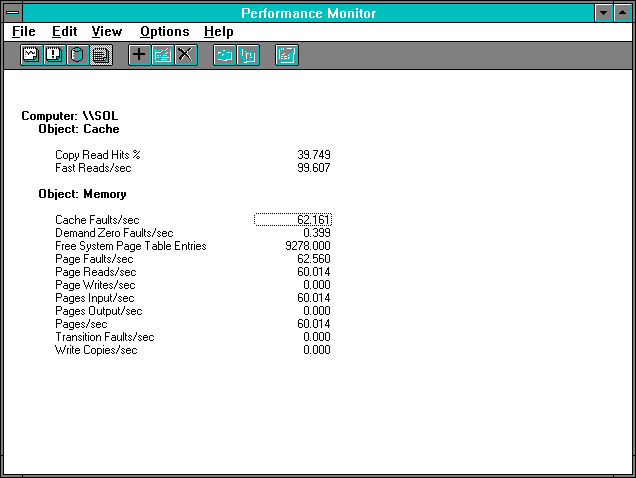
Figure 7.24 Memory manager's view of disk access on the server
All page faults are for cache activity, and the number of Pages Input/sec matches the Disk Reads/sec. At this point, while the cache is first being filled, only a few cache faults are satisfied by soft faulting an existing page in memory; most cache faults have to go to disk for the data.
What about the bottleneck? Well, the disk is busy 67.492% of the time, or 0.67492 seconds out of each second. If we divide this by the number of reads from the client each second, we get 0.006819 seconds of disk activity per interaction. The inverse of the interaction rate is 1 divided by Cache: Fast Reads/sec, or 0.010039, so we already have over half of the time spent going to disk. This makes the disk the bottleneck, even without going into all the other pieces of this particular puzzle.
But we can only make this declarative statement because all the pieces of the puzzle are in sequence. Because of sequencing, once we find a device with over half the time, we know no other device can have more than half. If there were any chance of parallelism among the processors, media, network adapters, and disk, then we would have to look more closely at the demand for each device.