We have explored processor, network, cache, and disk behavior using controlled experiments. Now we are prepared to look at a more realistic case. We'll have a client copy the %SystemRoot%\SYSTEM32 directory from the Windows NT server, and see what the result looks like. The first three figures are for the server side, and the next three are for the client side.

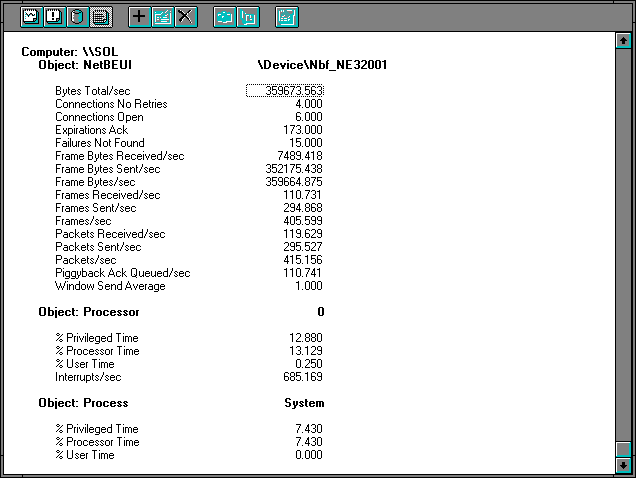
Figure 7.25 NetBEUI on the server during directory copy
The first thing to note is the number of bytes sent per frame is 1220, which (you know by now) we get from dividing the Frame Bytes Sent/sec by the Frames Sent/sec.
The observable processor time is low, and the value of Interrupts/sec is moderate. Whatever else we have done, we have not saturated the server's processor.
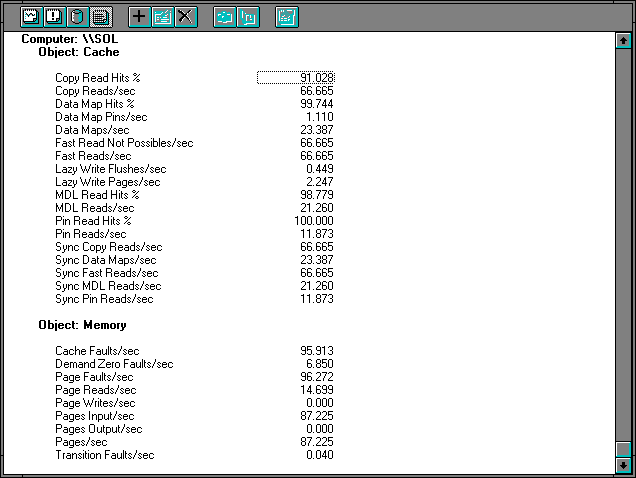
Figure 7.26 Cache and memory on the server during directory copy
The cache statistics show something we have not seen before. The bulk of the activity is in multiple data list (MDL) reads. MDL reads use the physical memory locations of cache pages to obtain multiple disk pages from disk in one operation. The server used MDL reads to get data from the disk. Nearly all of these requests are satisfied by data already in the cache, as indicated by the 98.779 MDL Read Hits %. The Data Map Hits % is high at 99.744%, for 23.387 Data Maps/sec. These are probably directory operations, which is not surprising since we are reading a large directory that contains many small files. You can also see the interaction of the cache with the memory manager. Nearly all of the Page Faults/sec are Cache Faults/sec. Many are resolved in memory with soft faults, but some 14.699 Page Reads/sec result from the 96.272 Page Faults/sec. Dividing the Pages Input/sec by the Page Reads/sec shows 5.934 pages are being read each time the memory manager goes to disk. This accounts for the high cache hit rates: the memory manager is reading ahead of requests effectively. Let's take a look at the disk.
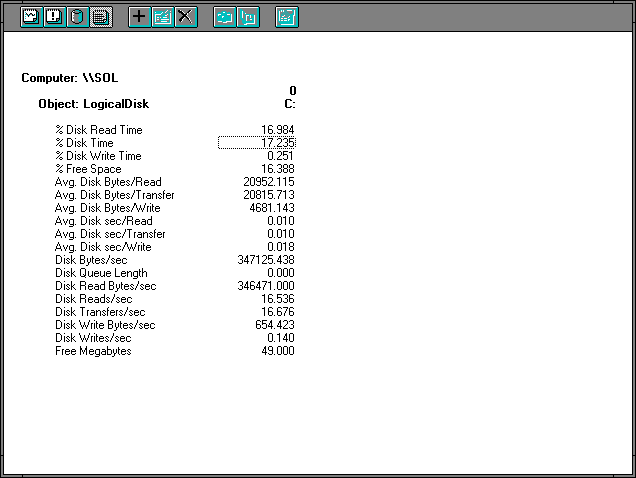
Figure 7.27 Disk activity on the server during directory copy
We see right away that there are 16.536 Disk Reads/sec, 1.837 reads per second over the Memory: Page Reads/sec. Also Avg. Disk Bytes/Read are 5.1 times the page size which the memory manager was reading. The extra reads are probably for directory information, bringing down the average number of pages read per disk access.
To make our bottleneck detection a little less painful, let's just see how much of each resource is used per second. For the processor we saw 0.13129 seconds, for the disk it's 0.17235, for the media we multiply the media transmission speed by Bytes Total/sec to get 0.28773 seconds, and for the adapter we have 0.077739. So far, the vote is for the Ethernet. But that's just the server side. Let's take a look at the client, too.
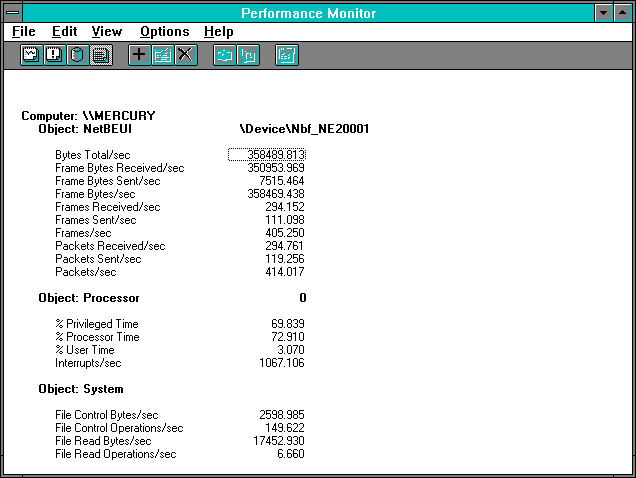
Figure 7.28 NetBEUI on the client during directory copy
These statistics naturally mirror the ones on the server side. There are some slight differences since we are not looking at precisely the same time intervals. The interrupt rate is a quite a bit higher here, and the processor usage is right up there at 72.910%.
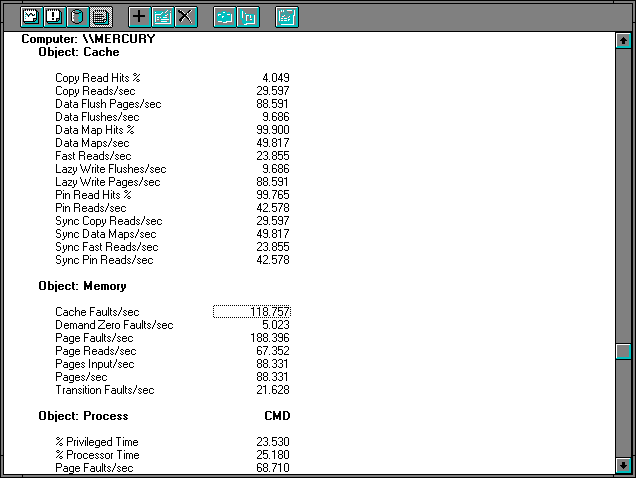
Figure 7.29 Cache and memory on the client during directory copy
On the client side, the cache- and memory-management story is a bit more complex. That is because we are reading into the cache across the network, copying from the cache into the application (in this case, CMD.EXE for the copy command), and then writing the data back into the cache to get it on the disk. This involves directory operations (Data Maps/sec) for both the server's directory and the client's, and we see the client rate is about double that of the server's. The hit rate on these directory operations is within Rule #9 of 100%.
There are 29.597 Cache: Copy Reads/sec by CMD.EXE. Very few hit the cache, which means one or more cache page faults are taken to resolve them. It looks like more than one, because the Memory: Cache Faults/sec is quite high at 118.757. The other Page Faults/sec are coming from CMD.EXE. A little careful thought sorts this all out. Many of the faults are resolved by mapping in existing page frames into the cache's working set, since they result in only 67.352 Page Reads/sec. This is because the memory manager and the cache manager are working together to bring sequential groups of pages into memory in single operations. It is also because many of the faults, 21.628/sec, are being resolved by transition faults, meaning they are pages which had been flushed from the cache and were being written to disk.
The 67.352 Page reads/sec result in 88.331 Pages Input/sec, which when multiplied by the page size is 361804bytes/sec, very close to the input NetBEUI data rate of 359665bytes/sec. These 67.352 Page Reads/sec turn into 111.098 NetBEUI Frames Sent/sec since directory operations are intermingled with the requests for file data. We conclude that only a few of the pages are coming from the client's disk. We see that CMD.EXE is generating soft faults at the rate of 68.710 Page Faults/sec, accessing buffers allocated and deallocated for the transfer of each file in the directory. This is also nearly equal to Page Faults/sec – Cache Faults/sec, so CMD.EXE accounts for all the page fault activity outside the cache.
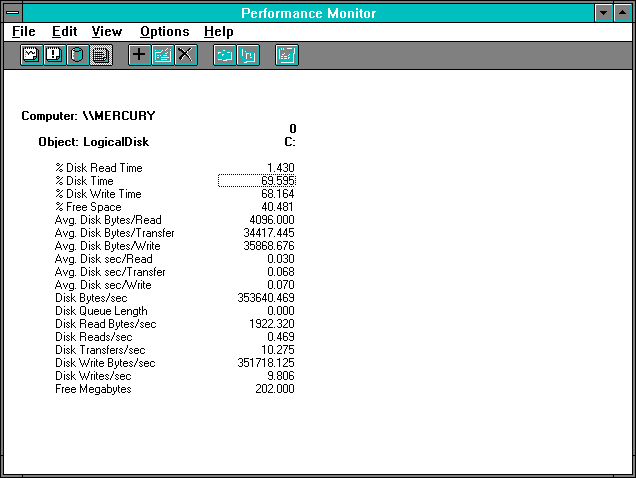
Figure 7.30 Disk activity on the client during directory copy
The disk itself on the client side is rather busy at 69.595 % Disk Time. Virtually all of this activity is writing.
The 35868.676 Avg. Disk Bytes/Write is quite high, and the 9.806 Disk Writes/sec come from the 9.686 Cache: Data Flushes/sec. The values of Disk Write Bytes/sec and NetBEUI: Frame Bytes Received/sec are almost identical. This disk is a lot busier than the one on the server side because the Avg. Disk sec/Write is 0.070 compared to an Avg. Disk sec/Read of 0.010 on the server. Even though there are more reads on the server per second, its overall access is more efficient. This may be for a variety of reasons: disk layout of the files, disk hardware, controller hardware, and who knows what all else. To isolate the issues, we'd have to study the disk subsystems as we did in Chapter 4, "Detecting Disk Bottlenecks." Alternatively we could just accept the fact that we paid a lot more for the server and, for once, we got what we paid for. Better tell the boss!
What about bottleneck detection on the client side? We've got processor utilization of 72.910%, and disk utilization of 68.164%. In a second of activity this means 0.72910 seconds of processor and 0.68164 seconds of disk. The processor wins the bottleneck award by a small margin. A classic case of one bottleneck masking another (remember the 2nd rule of Bottleneck Detection?) In both cases the device demands are larger than the demands on those devices on the server. This is as one might hope, since the server clearly has bandwidth to serve other clients simultaneously. Notice in passing the excellent overlap of processor and disk activity, since the sum of these device demands is just about 1.5 seconds/second.
Let's pause for a moment and regroup. We are now able to look at real systems doing real work and identify the bottleneck in a simplified client-server environment. We see it is not a foregone conclusion that the media is the bottleneck. We have found we must keep an eye on the disk and on the processor. We have learned when disk activity is the result of cache activity and we can recognize when it is not. We know enough to be able to look at statistics on a server and determine, by looking at processor, disk, protocol bytes, and interrupt rate, whether it is creating a bottleneck. We have reached one of those rare, hard-fought pinnacles of analysis from which we can leisurely survey the magnificent landscape. What a view!