Windows NT does not ship with debugging symbols in its modules because it takes many megabytes of disk space to provide them. So, as discussed previously, you should run apf32cvt on your application with no action specified. This will give you a list of the system DLLs (modules) you need to have with symbols. You can get the versions with symbols from the SUPPORT\DEBUG directory in the Windows NT SDK. First you rename the current system module; for example, type ren gdi32.dll gdi32.nsm. Then copy the one from the SDK to GDI32.DLL. Once you have done this for all the DLLs you want to measure, you must shut down and restart Windows NT so the modules with symbols get loaded.
Next we need to set up an initialization file called CAP.INI in the root directory of the C drive. CAP.INI has four sections that control the set of .EXEs and DLLs profiled. Each .EXE or .DLL listed must be placed on a separate line. It is important that you get the format of this file right, because otherwise Windows NT might not start. The four sections of CAP.INI are as follows:
Headers for the first three sections ([EXES], [PATCH IMPORTS], and [PATCH CALLERS]) are required to be in the CAP.INI file, but the contents of any section may be left blank. An additional section contains options for controlling measurement overhead in unusual situations. See the README file provided with CAP for details.
In our example we want to profile the Solitaire program, so our CAP.INI file looks like this:
|
[EXES]
sol.exe

[PATCH IMPORTS]
sol.exe

[PATCH CALLERS]
This profiles SOL.EXE and measures any calls it makes to functions in other modules, including the system DLLs. In our case, there is nothing after the [PATCH CALLERS] header. You'll want to use that section to profile particular DLLs that you've developed when you have listed in the [EXES] section the applications that call your DLLs.
We also want to measure the functions inside the Solitaire program, because we want to know where all those calls to GetPixel and SetPixel are coming from. And no, we can't just search the source for the calls, because they are called from many functions (nice try, though). So we'll recompile Solitaire specifying the -Gh and -Zd compiler options, and we'll link specifying the CAP.LIB library and using the -debugtype:coff and -debug:full linker options.
It's measurement time! We provide a Capdump program allowing you to control which application activity you measure. First we start Capdump, and then we start the recompiled version of Solitaire. We'll tell Capdump to clear the counters because we are not concerned at present about the performance while Solitaire starts. Once Capdump clears the counters, we press SHIFT+ALT+2 to activate the cascade. After the cascade is done, we shift to Capdump to dump the data. Data files with the default .CAP extension appear in the directory where each measured application resides.
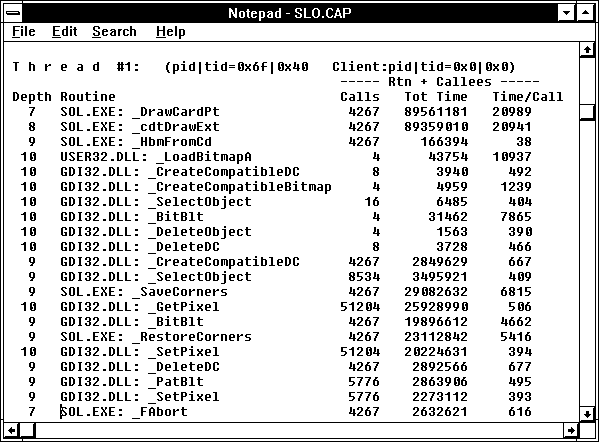
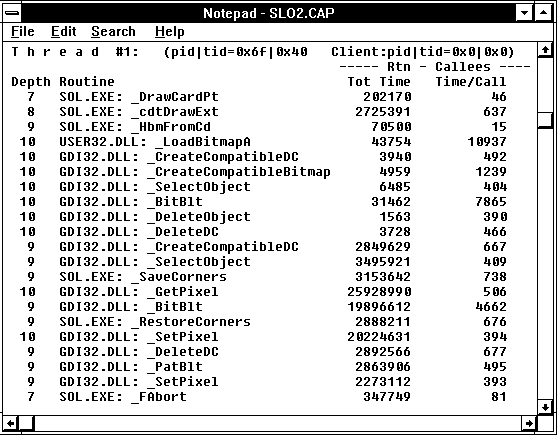
A center section of the results from the SOL.CAP file produced by this run are shown in Figure 10.7 for function times including called functions, and in Figure 10.8 for function calls excluding called functions.

Figure 10.7 Call/attributed profile of Solitaire cascade, called functions included

Figure 10.8 CAP of Solitaire cascade, excluding called functions
In the leftmost column is the function call nesting depth. This starts at zero with the first function call that CAP encounters. If a function is called but has not returned when the data is dumped, there will be an asterisk to the left of this number. Next we have a column with the module name followed by the function name. If the function is not known because the coff symbols with the function names in them are not contained in the module, ???: ??? will appear instead of module: function.
This section of the results, where SOL.EXE executed for 89 seconds, starts at call level 7 with _DrawCardPt, which was called 4267 times. It called _cdtDrawExt each time it was called, and that called _HbmFromCd. We didn't spend much time here: only 1.6 out of the 89 seconds. This called the USER32.DLL Win32 API call _LoadBitMapA four times. The final "A" in this function name means this is the ASCII form of the call, so right away we know that Solitaire is not a Unicode application (in which case it would have been a final "W"). But Solitaire does almost no text output, so maybe we can let that pass. The _HbmFromCd call used some graphics primitives in GDI32.DLL, but only a few times even though it was called 4267 times. So this is not the central cause of the poor performance.
The call level returns to 9 which means _cdtDrawExt at level 8 is back in control. We see from Figure 10.7 that even though we spent 89 seconds in this routine and the routines it called, we spent only 2.7 seconds in the routine itself. The other 86-plus seconds were in the functions it called.
Let's see where. It calls _CreateCompatibleDC each time it is called, and then _SelectObject twice on every call. We have over 6 seconds between them. Looks like we should investigate an own DC for Solitaire. Then there is a call to _SaveCorners, which takes 29 seconds. Looking at Figure 10.8 we see only 3.1 seconds in _SaveCorners itself, so the rest must be in GetPixel. A similar story applies to _RestoreCorners and _SetPixel right after the call to _BitBlt.
We went to the developer porting Solitaire at this point and asked what on earth _SaveCorner and _RestoreCorners were up to. It turned out that they modify three pixels on each corner of the bitmap of a card to make the corner look a little more rounded. We shared our observation that this was excessive refinement when cards were cascading on the screen, and how each call forced a client-server transition. We discussed using SetPixelV to remove one of the client-server transitions, but decided the real solution was to remove the calls altogether during a cascade. This was a very small change, just a few lines of code, but it made the Solitaire cascade twice as fast.