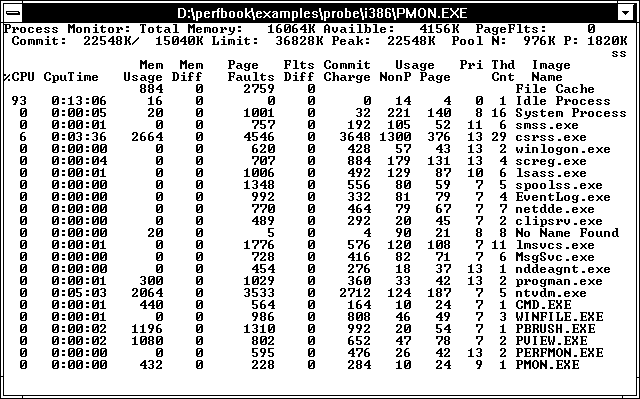
PMon is another handy program. PMon shows in a console window the memory usage of each running process, and of the cache. PMon updates its statistics every five seconds. A sample of the display is in the next figure.

Figure 10.21 PMon view of the universe
At the top of the display you see some system global statistics: memory size and available bytes, the virtual memory commitment, and pool sizes.
Then, for each process, PMon shows processor usage during the last update interval. The next column is total processor time in the format hours:minutes:seconds. The third column is how many pages each process is using, and then the change since the last update. PMon also shows how many Page Faults have occurred in the process, and the change since the last update. Next is the virtual memory commitment charge, and then the pool usage estimates for the process. Finally you see process priority, and number of threads. There's nothing here that is not in Performance Monitor, but this is a pretty darn handy overview that requires no selections to be made.