As you use Performance Monitor and other monitoring tools, remember their limitations. Understanding the range and resolution of your tools is essential to accurate diagnosis.
It's important to know just what your counters are counting. In each section of this book, we try to mention how the counters measure as well as what they measure. This information is important, especially when you are interpreting suspicious data or getting inconsistent results.
The Update Interval you select on the Options dialog box is designed to determine how often Performance Monitor measures counter values. However, Performance Monitor is just another application contending for processor time. On a busy computer, Performance Monitor might be competing with higher priority threads for access to the processor and might not be able to update the counters as frequently as you choose.
If Performance Monitor appears to be updating less frequently, chart the Process: % Processor Time or Process: Priority Base counters on all processes, including the Performance Monitor process, Perfmon.exe. Look for processes with high priorities or those getting a disproportionate share of processor time. These might be preventing Performance Monitor from updating at the rate you chose. Performance Monitor runs at a elevated base priority to make sure it can monitor under most circumstances, but it can get locked out like any other process. If necessary, you can use Task Manager to increase the base priority class of Perfmon.exe. For more information, see "Changing the Base Priority Class" in Chapter 11, "Performance Monitoring Tools."
It is difficult to detect multiple bottlenecks in a system. You might spend several days testing and retesting to identify and eliminate a bottleneck, only to find that another appears in its place. Only thorough and patient testing of all elements can assure that you have found all of the problems.
It is not unusual to trace a performance problem to multiple sources. Poor response time on a workstation is most likely to result from memory and processor problems. Servers are more susceptible to disk and network problems.
Also, problems in one component might be the result of problems in another component, not the cause. For example, when memory is scarce, the system begins moving pages of code and data between disks and physical memory. The memory shortage MESMESis manifest in increased disk and processor use, but the problem is memory, not the processor or disk.
Lack of memory is by far the most common cause of serious performance problems in computer systems. If you suspect other problems, check Memory: Pages/sec to make sure a memory shortage is not appearing in another guise.
Monitoring processes and threads is an essential part of tuning software performance and understanding how applications affect your hardware. However, some Performance Monitor counter values might be invalid if the threads or processes are stopping and starting while Performance Monitor is watching.
When processes with the same name start and stop, Performance Monitor sometimes mistakes them for a single process and combines the data for different processes into a single graph or report line. Threads are even more prone to mistaken identity and combination, because Performance Monitor knows them only by their thread number, a number which only indicates the order in which the threads started. JBJB
Fortunately, you can recognize and eliminate errant values from your data:
It is important to recognize when Performance Monitor has combined processes and to distinguish the values for each process from values for the others. Also, you must recognize and eliminate invalid data spikes which sometimes occur when you start a monitored process.
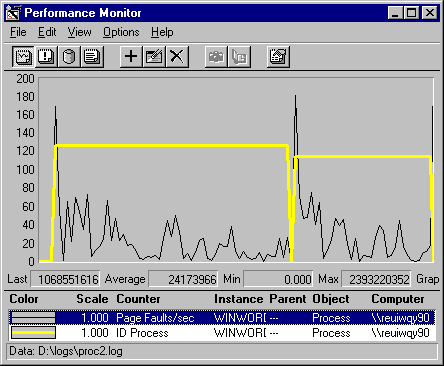
Data for the following graph was collected by starting Microsoft Word, stopping it, then starting it again. The thick line, representing Process ID, shows that the process ID changed (from 126 to 114). Because Process IDs do not change while a process is executing, this indicates that data from two different processes are represented in the same line. A graph of Process ID data is straight unless it represents data from more than one process.

The thin line, representing page fault rates for the Microsoft Word process, Winword.exe, has two large spikes of unusually high values, as reflected in the status bar. These spikes don't represent page faults; they happen when processes with the same name stop and start.
Performance Monitor counters that measure rates/second or percentages actually display the change in value of an ever increasing internal counter associated with each object. When a process stops, the internal counter drops to zero and the change, as reported to Performance Monitor, is the absolute value of the largest long integer the computer's memory holds. Performance Monitor politely displays a zero.
However, when a new process starts, the difference between this huge number and the new thread value is displayed, causing the high value. The next value, the average of the last two, falls back to a more reasonable number.
The high values are not valid, nor are averages that include them. You can use the Performance Monitor Time Window, described later in this chapter, to exclude them from your sample. The remaining data is valid, but you might want to separate the data for the first process from data for the second process.
Threads don't have names. They have thread numbers and Thread IDs. Performance Monitor collects and displays data on threads by process name and thread number. The thread number just indicates the order in which the threads started, beginning with 0. When a thread stops, the thread numbers of all of the threads behind it move up. For example, if a process has two threads, numbered 0 and 1, and thread 0 stops, thread 1 becomes thread 0. If Performance Monitor is watching, the counts for thread 0 now include data from both the old thread 0 and the new one.
Note
Do not confuse the terms used to identify threads and processes. Here are some descriptions to help you distinguish among them.
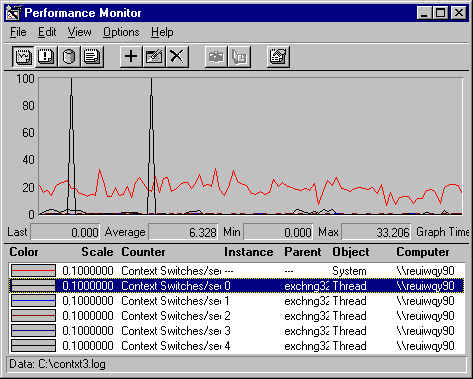
That is what happened when data for this graph was collected.

The spikes are a warning that the context switching rates shown for the threads might be invalid. This graph also includes the system-level counter for context switches, which runs at an average of about 200 context switches per second. Since the values in the spikes of Thread #4 are higher than system totals, it is clear that the high values represent threads starting and stopping, not context switches.
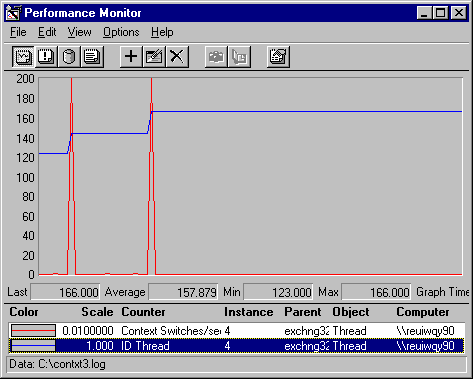
A graph of Thread ID confirms this guess. Thread ID, like Process ID (but unlike thread number), is assigned to the thread by the operating system and remains with it until it stops running.

Each spike in the context switch graph coincides with a change in the thread ID. Thread 123 is the first thread identified to Performance Monitor as Thread #4. When it stops, data from Thread 143, which used to be Thread #5, is now collected as Thread 4. When Thread 143 stops, Thread 166, formerly Thread #5, now becomes thread #4.
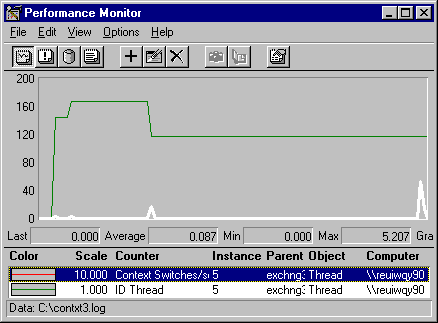
These characteristic spikes are sufficient warning that some data is invalid, but they don't always appear. The following figure shows a different view of the same process.

This is a graph of Thread ID and context switches for Thread #5 of the same process. In this case, the Thread IDs change, indicating that data from more than one thread is combined. However, there are no large spikes, even though the values are multiplied by 10, because none of the threads stopped while they were being monitored.
Each time the thread in Thread #4 stops, the fifth thread becomes Thread #4 and Thread #5 inherits a thread from Thread #6. The little peaks show the difference in the values of two running threads.
Although there are no spikes, data from this graph should still be distinguished by Thread ID and the data surrounding the thread transitions should be discarded. For more information on selecting data, see "The Time Window" later in this chapter.