This chapter does not contain any references to chart colors. No text changes are required for the online version of the documents.
A collection of general purpose monitoring tools is available to augment and complement Performance Monitor. This chapter describes them.
Tool | Location |
Task Manager | Integrated into Windows NT 4.0 Workstation and Server. |
Performance Data Log Service (PerfLog) | Resource Kit \PerfTool\MeasTool |
Pentium Counters | Resource Kit \PerfTool\P5Ctrs |
Process Monitor (PMON) | Resource Kit \PerfTool\MeasTool and \Computer Diagnostics |
Process Explode (PView) | Resource Kit \PerfTool\MeasTool and \Computer Diagnostics |
Process Viewer (PViewer) | Resource Kit \PerfTool\MeasTool and Computer Diagnostics |
The SC Utility | Resource Kit \Computer Configuration |
Data Logging Service | Resource Kit \PerfTool\MeasTool\ Datalog.exe and Monitor.exe |
Microsoft Test | Microsoft product purchased separately |
Response Probe | Resource Kit \PerfTool\Probe |
This is not intended to be a complete list of performance monitoring tools. For more information about the tools on the Windows NT Resource Kit 4.0 CD, see the Alphabetical List of Tools in Rktools.hlp.
In addition to the general purpose tools described in this section, more specific tools are discussed throughout the book. They are listed here for reference only.
Tool | Description | Location | Chapter reference | |||||
Start | Starts a process and lets you set its properties, including priority, and whether it runs in a separate or shared memory space. | Included in Windows NT | Ch. 9, "The Art of Performance Monitoring" Running 16-bit Windows Applications in a Separate Process. Ch. 13, "Detecting Processor Bottlenecks" Measuring and Tuning Priority | |||||
Extensible Counter List | Lists installed Performance Monitor counters that did not come with Windows NT. | Resource Kit \PerfTool\CntrTool | Ch. 10, "About Performance Monitor" Performance Monitor Troubleshooting Features | |||||
CreateFile | Creates a zero-filled file of a size you specify | Resource Kit \PerfTool\Probe | Ch. 11, "Performance Monitoring Tools" Creating Simulated Files | |||||
Clearmem | Allocates all available memory, then releases it. | Resource Kit \PerfTool\MeasTool | Ch. 12, "Detecting Memory Bottlenecks" Determining the Minimum Working Set | |||||
Page Fault Monitor (PFMON) | Produces a detailed report on all hard and soft page faults for a process | Resource Kit \PerfTool\MeasTool | Ch. 12, "Detecting Memory Bottlenecks" Examining Your Applications | |||||
Working Set Tuner | Analyzes the patterns of function calls in your application code and recommends an organization that consumes the least possible physical memory. | Win32 Software Development Kit | Ch. 12, "Detecting Memory Bottlenecks" Examining Your Applications | |||||
LeakyApp | Allocates all available memory to its process and retains it until it is stopped. | Resource Kit \PerfTool\MeasTool | Ch. 12, "Detecting Memory Bottlenecks" Examining Your Applications | |||||
CPU Stress | Creates a single-threaded or multithreaded process using processor time. Users choose the number of threads and set the priorities of the process and its threads, the threads' activity level. | Resource Kit | Ch. 13, "Detecting Processor Bottlenecks" | |||||
TotlProc | Installs a counter for measuring processor time on applications launched by the system interrupt. | Resource Kit \PerfTool\TotlProc | Ch. 13, "Detecting Processor Bottlenecks" Processor Sampling | |||||
Performance Meter | Lists current statistics on the file system cache. | Resource Kit \PerfTool\MeasTool | Ch. 15, Detecting Cache Bottlenecks" | |||||
Note
The tools on the Windows NT Resource Kit 4.0 CD are not supported. Whenever possible, use Performance Monitor and Task Manager, supported tools integrated into Windows NT.
Some tools are included in more than one category, so some duplication might occur. You can delete the duplicates.
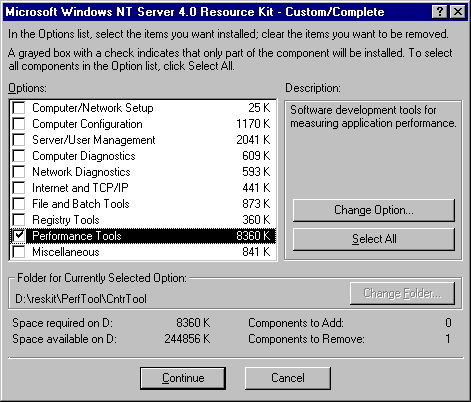
Several of these tools are included on the Windows NT Resource Kit 4.0 CD. To install them, use the Setup program on the CD. To install all tools, use the Typical Installation mode in Setup. Use Custom Installation to install just one category of tools. Some Custom Installation categories, including Performance Tools, let you install the tools selectively. In Setup, click Performance Tools, then click Change Option to select a tool from the group.
The following figure shows the Custom/Complete dialog box of the Setup program configured so that only the performance tools are installed.
