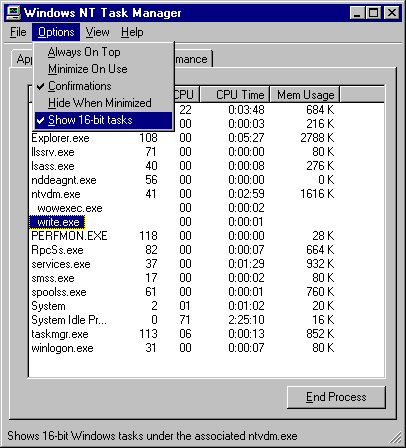
Click the Task Manager Processes tab to see a list of running processes and measures of their performance. The Task Manager process table includes all processes that run in their own address space, including all applications and system services. From the Options menu, click Show 16-bit Tasks to include those in the display.
For a description of the most common system services that appear in the list, see "System Processes," in Chapter 9, "The Art of Performance Monitoring."
Note
Task Manager displays its values in kilobytes, which are units of 1024 bytes. When comparing Performance Monitor and Task Manager values, multiply Task Manager values by 1024. For example, 108K bytes of memory usage for Explorer.exe, shown below, equals 110,592 bytes in Performance Monitor.

From the View menu, click Select Columns to add to or remove performance measures from the display. The following table briefly describes the measures and their Performance Monitor counterparts, if any.
|
| Performance Monitor Process counter | |||||||
Image Name | Name of the process. | The process name in the Instances box. | |||||||
PID (Process Identifier) | Numerical ID assigned to the process while it runs. | ID Process. | |||||||
CPU Usage | The percentage of time the threads of the process used the processor since the last update. | %Processor Time. | |||||||
CPU Time | The total processor time used by the process since it was started, in seconds. | None. | |||||||
Memory Usage | The amount of main memory used by the process, in kilobytes. | Working Set. | |||||||
Memory Usage Delta | The change in memory use since the last update, in kilobytes. Unlike Performance Monitor, Task Manager displays negative values. | None. | |||||||
Page Faults | The number of times data had to be retrieved from disk for this process because it was not found in memory. This value is accumulated from the time the process is started. | None. Page faults/sec is the rate of page faults over time. | |||||||
Page Faults Delta | The change in the number of page faults since the last update. | None. | |||||||
Virtual Memory Size | Size of the process's share of the paging file, in kilobytes. | Page File Bytes. | |||||||
Paged Pool | Amount of the paged pool (user memory) used by the process, in kilobytes. The paged pool is virtual memory available to be paged to disk. It includes all of user memory and a portion of system memory. | Pool Paged Bytes. (See note below.) | |||||||
Nonpaged Pool | Amount of the nonpaged pool (system memory) used by the process, in kilobytes. The nonpaged pool is operating system memory which is never paged to disk. | Pool Nonpaged Bytes. (See note below.) | |||||||
Base Priority | The base priority of the process, which determines the order in which its threads are scheduled for the processor. The base priority is set by the process code, not the operating system. The operating system sets and changes the dynamic priorities of threads in the process within the range of the base. Use Task Manager to change the base priority of processes. See the next section for details. | Priority Base. | |||||||
Handle Count | The number of object handles in the process's object table. | Handle Count. | |||||||
Thread Count | The number of threads running in the process. | Thread Count. | |||||||
Important
The size of the paged and nonpaged memory pools, as shown on the Process tab, are not precise. These values are taken from internal counters which count duplicated object handles as well as space for the object. Also, they are rounded to page size, so if a process is using part of a page, its pool space is overestimated. However, they can be used to monitor changes in the size of the pool for a process.
The paged and nonpaged pool size for the whole system, shown on the Performance tab, are precise. Thus, the sum of values for each process might not match the count for the whole system.
Task Manager, Performance Monitor, Process Explode (Pview.exe), Process Monitor (Pmon.exe) and Process Viewer (Pviewer.exe) all use the same internal counters for monitoring the paged and nonpaged memory pools.
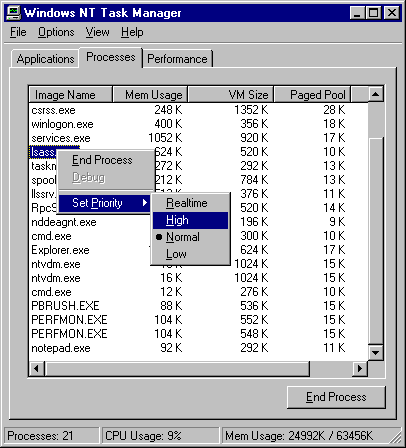
The base priority class of a process determines the range of dynamic or current priorities that the operating system can assign to the threads of that process. The base priority is usually set in the application code. You can use Task Manager to change the base priority class of a process. However, this change lasts only as long as the process runs. When the process is started again, it reverts to the original base priority class.
In a preemptible, multitasking operating system like Windows NT, the microkernel schedules threads for the processor in order of their priority and interrupts running threads if a higher priority thread appears.
You might want to increase the priority of a process, or decrease the priority of competing processes to improve their response.
Warning Changing the base priority class of a process to Real-Time can destabilize your system. A busy, Real-Time process can prevent other processes and system services from running.
To change the base priority class of a process, select the process name from the Task Manager Processes tab, click the highlighted name with the right mouse button, click Set Priority, and then select a new priority class from the Set Priority submenu.

You can use Task Manager to limit the execution of a process to one or more processors.
Note
The Set Affinity option used for selecting a processor appears only on computers with more than one processor.
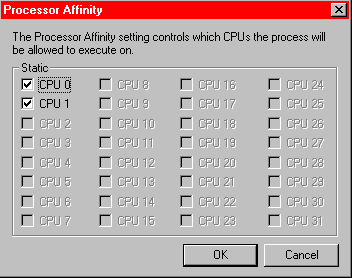
On multiprocessor computers, the Windows NT microkernel distributes thread-processing requests over all processors based on thread priority. Often, the threads of a single process are running on more than one processor. Windows NT uses soft affinity to distribute processor load. This means that when all other factors are equal, Windows NT reassigns threads to the same processor they ran on before. This takes best advantage of the processor cache. However, you can override this configuration and determine on which processors your processes run.
You might want to expedite a process by reserving a processor for it and rerouting all other processes to other processors.
To select processors for a process, click the process name in the Task Manager Processes tab, click the highlighted name with the right mouse button, click Set Affinity, and the select one or more processors from the list.

If you have installed a debugger, you can activate the debugger on a process by using Task Manager. Click the process name in the Task Manager Processes tab. Then click the highlighted name with the right mouse button and click Debug.
You can control the rate at which Task Manager updates its counts. This will reduce Task Manager overhead, but might miss some data. You can force an update at any time by clicking Refresh Now on the View menu or by pressing f5.
Task Manager Update Speed options are:
High | Updates every half-second. |
Normal | Updates once per second. |
Low | Updates every four seconds. |
Paused | Does not update automatically. Press F5 to update. |