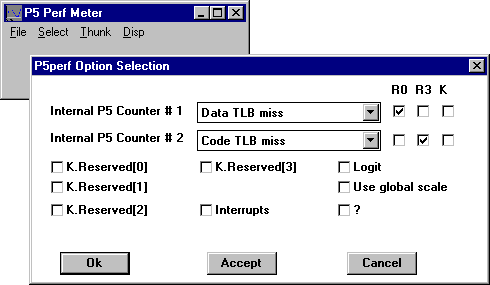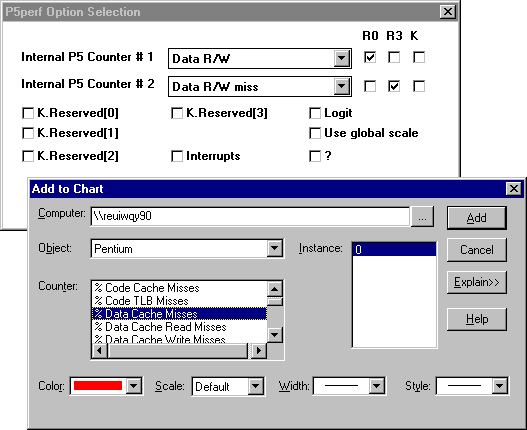
Intel Pentium and Pentium Pro processors have special counters that monitor the inner workings of the chip. You can see a graph of these counters by using Pperf, a tool on the Windows NT Resource Kit 4.0 CD. Better yet, you can set up the counters by using Pperf, and then use Performance Monitor to chart, log, report, or set alerts on them.
Tip
The Pentium counters are extensible counters for Windows NT. You can confirm that the installation of these counters was successful and find useful information about them by using Extensible Counter List, a tool on the Windows NT 4.0 Workstation Resource Kit CD. Extensible Counter List is in the Performance Tools group in \PerfTool\Cntrtool\Exctrlst.exe. For more information, see Rktools.hlp.
1. Install the P5Ctrs directory from the Windows NT Resource Kit 4.0 CD. It is in the Performance Tools group in \PerfTool\P5Ctrs.
2. Complete the installation of Pperf by loading new registry values, copying some files to different directories, and installing counter names and explain text for the Pentium counters in Performance Monitor. For instructions, see P5perf.txt, in the P5Ctrs subdirectory.
3. Use Pperf to activate the Pentium counters by selecting them and assigning them to registers You activate two at a time. For instructions, see P5perf.txt, in the P5Ctrs subdirectory.

4. In Performance Monitor, select the Pentium object, then select one or both of the counters you activated with Pperf.
Note
The Pentium object and the names of all Pentium counters appear in Performance Monitor when you complete the installation of Pperf. However, only the counters you activate by using Pperf will display valid values in Performance Monitor.
And, as you can with any Windows NT 4.0 application, you can create a shortcut to Pperf on your desktop.
There are two types of Pentium counters: simple and composite. Simple counters require that one Pperf counter be activated for each Performance Monitor. Composite counters require that two Pperf counters be activated for each Performance Monitor counter.
For example, to use the simple counter, FLOPs/sec, in Performance Monitor, FLOPs must be activated in Pperf. However, to use the composite counter % Data Cache Misses in Performance Monitor, both Data R/W and Data R/W Miss must be activated in Pperf.

The following table associates the Pentium counters with the Pperf counters that activate them:. Descriptions of the counters appear in the Explain text in Performance Monitor.
Pentium Counter (as seen in Performance Monitor) | Required Pperf Counters |
| |
% Branch Target Buffer Hit | Branches and BTB hits |
% Branches | Instructions executed and Branches |
% Code Cache Misses | Code Read and Code cache miss |
% Code TLB Misses | Code Read and Code TLB miss |
% Data Cache Misses | Data R/W and Data R/W miss |
% Data Cache Read Misses | Data Read and Data Read miss |
% Data Cache Write Misses | Data Write and Data Write miss |
% Data Snoop Hits | Data cache snoops and Data cache snoop hits |
% Data TLB Misses | Data R/W and Data TLB miss |
% Segment Cache Hits | Segment cache accesses and Segment cache hits |
% V-Pipe Instructions | Instructions executed and Instructions executed in vpipe |
Bank Conflicts/sec | Bank conflicts |
Branches Taken or BTB Hits/sec | Taken branch or BTB hits |
Branches/sec | Branches |
BTB Hits/sec | BTB hits |
Bus Utilization (clks)/sec | Bus utilization (clks) |
Code Cache Miss/sec | Code cache miss |
Code Read/sec | Code Read |
Code TLB Miss/sec | Code TLB miss |
Data Cache Line WB/sec | Data Cache line WB |
Data Cache Snoop Hits/sec | Data Cache snoop hits |
Data Cache Snoops/sec | Data Cache snoops |
Data R/W Miss/sec | Data R/W miss |
Data Read Miss/sec | Data Read miss |
Data Read/sec | Data Read |
Data Reads & Writes/sec | Data R/W |
Data TLB Miss/sec | Data TLB miss |
Data Write Miss/sec | Data Write miss |
Data Write/sec | Data Write |
Debug Register 0 | Debug Register 0 |
Debug Register 1 | Debug Register 1 |
Debug Register 2 | Debug Register 2 |
Debug Register 3 | Debug Register 3 |
FLOPs/sec | FLOPs |
I/O R/W Cycle/sec | IO r/w cycle |
Instructions Executed In vPipe/sec | Instructions executed in vpipe |
Instructions Executed/sec | Instructions executed |
Interrupts/sec | Interrupts |
Locked Bus Cycle/sec | Locked bus cycle |
Memory Accesses In Pipes/sec | Memory Accesses in pipes |
Misaligned Data Refs/sec | Misaligned data refs |
Non_Cached Memory Ref/sec | Non_cached memory ref |
Pipe Stalled On Addr Gen (clks)/sec | Pipe stalled on addr gen (clks) |
Pipe Stalled On Read (clks)/sec | Pipe stalled on read (clks) |
Pipe Stalled On Writes (clks)/sec | Pipe stalled on writes (clks) |
Pipeline Flushes/sec | Pipeline flushes |
Segment Cache Accesses/sec | Segment cache accesses |
Segment Cache Hits/sec | Segment cache hits |
Segment Loads/sec | Segment loads |
Stalled While EWBE#/sec | Stalled while EWBE# |
Write Hit To M/E Line/sec | Write hit to M/E line |