High, sustained paging rates indicate a memory shortage, but not its cause. You might have insufficient physical memory to support the operating system, applications, and network services. However, you might have an application that is using memory inefficiently or leaking memorythat is, allocating memory, but not releasing it.
When the hard page fault rate on your system rises, investigate the memory use of your applications by using the following counters:
The first step is to distinguish between a general memory shortage that is affecting all applications and a memory shortage caused by a particular application. Chart Process: Page Faults/sec for all processes.
The following graph shows a general memory shortage that is causing page faults in many processes.

In this example, Memory: Page Faults/sec (the tall white bar) represents all page faults for the system. The other bars represent page faults for each application or service running on the system. This graph demonstrates that no single application is causing a memory shortage. In this case, the high paging rate is best resolved by adding more physical memory.
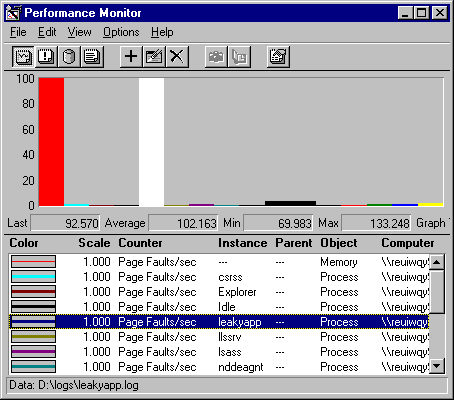
In contrast, the following graph shows a single application, LeakyApp, a test tool, causing a high rate of page faults.

In this example, Memory: Page Faults/sec (the first tall bar) represents all page faults for the system. The tall white bar represents page faults for the test tool. The other bars, which are barely visible, represent the fault rates of other processes.
Although this memory shortage affects all system processes, it is attributable to a single application. Were it a real application instead of a test tool, a more thorough investigation would be in order. It would be prudent to consider replacing the application, moving it to another computer or, if it is your application, trying to improve it memory efficiency.
The standard performance monitoring tools are designed to determine that an application is using memory inefficiently, but not why. If you have an inefficient application, use the following tools for further diagnosis:
The remainder of this section explains how to determine the effect of application memory use on your system.