Some disks and disk configurations perform better when reading than when writing. You can compare the reading and writing capabilities of your disks by reading from a physical disk and then writing to the same physical disk.
To measure reading from and writing to disk, log the Logical and Physical Disk objects in Performance Monitor, then chart the following counters:
Reading | Writing |
Avg. Disk Bytes/Read | Avg. Disk Bytes/Write |
Avg. Disk sec/Read | Avg. Disk sec/Write |
Disk Read Bytes/sec | Disk Write Bytes/sec |
Disk Reads/sec | Disk Writes/sec |
On standard disk configurations, you will find little difference in the time it takes to read from or write to disk. However, on disk configurations with parity, such as hardware RAID 5 and stripe sets with parity, reading is quicker than writing. When you read, you read only the data; when you write, you read, modify, and write the parity, as well as the data.
Mirror sets also are usually quicker at reading than writing. When writing, a mirror set writes all of the data twice. When reading, it reads simultaneously from all disks in the set. Magneto-optical devices (MOs), known to most of us as Read/Write CDs, also are quicker at reading than writing. When writing, they use one rotation of the disk just to burn a starting mark and then wait for the next rotation to begin writing.
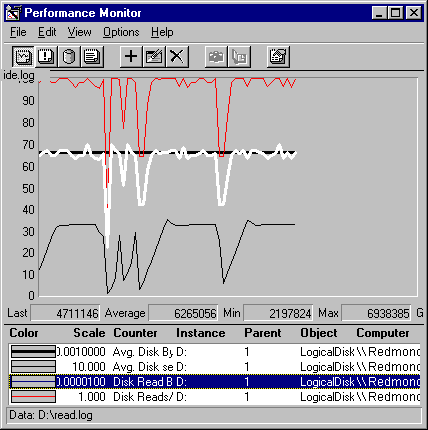
The following graph shows a test of disk-reading performance. A test tool is set to read 64K records sequentially from a 60-MB file on a SCSI drive. The reads are unbuffered, so the disk can be tested directly without testing the program's or system's cache efficiency. Performance Monitor is logging every two seconds.
Note
The test tool used in this example submits all of its I/O requests simultaneously. This exaggerates the disk time and Avg. Disk sec/Transfer counters. If the tool submitted its requests one at a time, the throughput might be the same, but the values of counters that time requests would be much lower. It is important to understand your applications and test tools and factor their I/O methods into your analysis.

In this graph, the top line is Disk Reads/sec. The thick, black, straight line running right at 64K is Avg. Disk Bytes/Read. The white line is Disk Read Bytes/sec, and the lower thin, black line is Avg. Disk sec/Read. The scale of the counters has been adjusted to fit all of the lines on the graph, and the Time Window eliminates the starting and ending values from the averages.
In this example, the program is reading the 64K records from Logical Drive D and writing the Performance Monitor log to Logical Drive E on the same physical disk. The drive is doing just less than 100 reads and reading more than 6.2 MB per second. At the points where the heavy black and white lines meet, the drive is reading 100 bytes per second. Note that reading 6.2 MB/sec is reading a byte every 0.00000016 of a second. That is fast enough to avoid a bottleneck under almost any circumstances.
However, Avg. Disk sec/Read is varying between 0.05 and 3.6 second per read, instead of the 16 milliseconds that would be consistent with the rest of the data (1 second/64K bytes). As noted above, the value of Avg. Disk sec/Read tells us more about the test tool and the Performance Monitor counters than about the disk. However, you might see something like this, so it's worth understanding.
Avg. Disk sec/Read times each request from submission to completion. If this consisted entirely of disk time, it would be in multiples of 16 milliseconds, the time it takes for one rotation of this 3600 RPM disk. The remaining time counted consists of time in the queue, time spent moving across the I/O bus, and time in transit. Since the test tool submits all of I/O operations to the device at once, at a rate of 6.2 MB per second, the requests take 3 seconds, on average.
There are some noticeable dips in the curves of all three graphs. If Performance Monitor were logging more frequently, you could see that the disk stops reading briefly so that it can write to the log and update file system directories. It then resumes reading. Disks are almost always busy with more than one process, and the total capacity of the disks is spread across all processes. Although the competing process just happens to be Performance Monitor, it could be any other process.
The following graph shows the effect of writing on the efficiency of the reads.
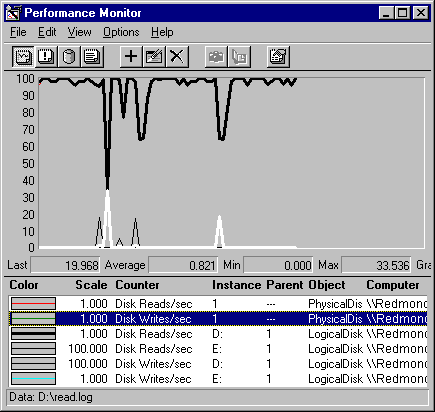
In this graph, several lines are superimposed, because the values are nearly the same. The thick, black line is Physical Disk: Disk Reads/sec and Logical Disk: Disk Reads/sec for Drive D; the thick, white line is Physical Disk: Disk Writes/sec and Logical Disk: Disk Writes/sec for Drive E. The thin, black blips at the bottom of the graph are Disk Reads/sec on Drive E and Disk Writes/sec on Drive D, both magnified 100 times to make them visible.
Although Disk Writes/sec on Drive D are negligible, fewer than 0.05 per second, on average, Performance Monitor is writing its log to Drive E, the other logical partition on the physical disk. This accounts for the writing on Physical Drive 1. Although the logical partitions are separate, the disk has a single head stack assembly that needs to stop reading, however briefly, while it writes. The effect is minimal here, but it is important to remember that logical drives share a physical disk, especially because most disk bottlenecks are in shared physical components.
The report on this graph shows the average values, but averages obscure the real activity, which happens in fits and starts. The following figure shows an Excel spreadsheet to which the values of writing to Drive D have been exported.
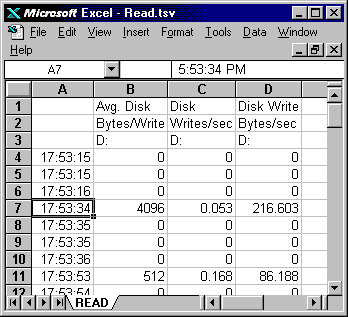
Drive D is also writing, just to update file system directory information. It writes a page (4096 bytes), then a sector (512K bytes)—the smallest possible transfer on this disk. You can multiply column B, Disk Bytes/Write by column C, Disk Writes/sec, to get column D, Disk Write Bytes/sec. Although the transfer rates aren't stellar here, we are reading very small records and have an even smaller sample.
The spreadsheet for Drive E follows.
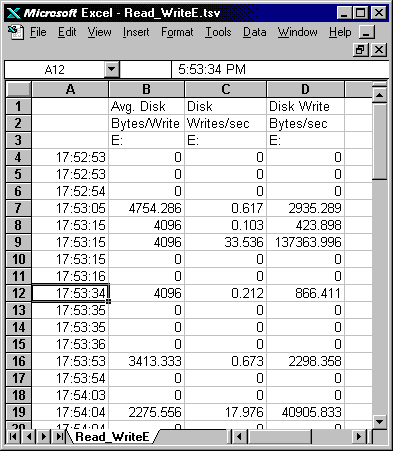
This shows the wide variation of writes in this small sample. In general, Drive E is writing about a page at a time, but the transfer rate varies widely, from less than a page per second, up to 33.5 pages per second. However, this small amount of writing is enough to account for the dips in the main reading data.
The graphs of writing to this simple disk configuration are almost the same as those of reading from it. The test tool is set to write sequential 64K records to a 60 MB file on a SCSI drive. The writes are unbuffered, so they bypass the cache and go directly to disk. Performance Monitor is logging once per second.
Note
Disks cannot distinguish between writing a file for the first time and updating an existing file. Recognizing and writing only changes to a file would require much more memory than is practical. The writing tests in this chapter consist of writing new data to disk, but writing changes to data would produce the same results.
The following figure shows the reading and writing measures side by side. The top graph measures reading; the bottom, writing.
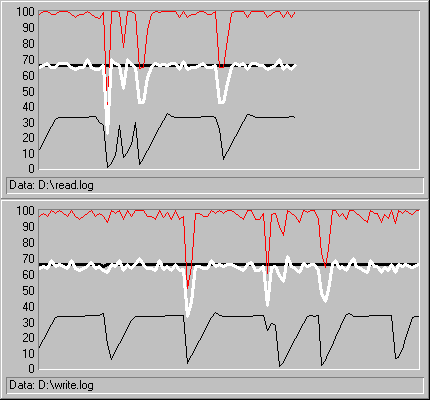
In these graphs, the lines (from top to bottom of each graph) represent
Reading (top graph) | Writing (bottom graph) |
Disk Reads/sec | Disk Writes/sec |
Avg. Disk Bytes/Read (thick, black line) | Avg. Disk Bytes/Write (thick, black line) |
Disk Read Bytes/sec (white line) | Disk Write Bytes/sec (white line) |
Avg. Disk sec/Read ( thin, black line) | Avg. Disk sec/Write ( thin, black line) |
The actual values are almost identical or vary only within experimental error. The dips in the values represent the time the disk spent writing the Performance Monitor log to the other logical drive.
If you have enough disks, you can eliminate the variation caused by Performance Monitor logging. The following graph shows the test tool writing sequential 64K records to a 40 MB file. Because Performance Monitor is logging to a different physical drive, the logging does not interfere with the writing test.
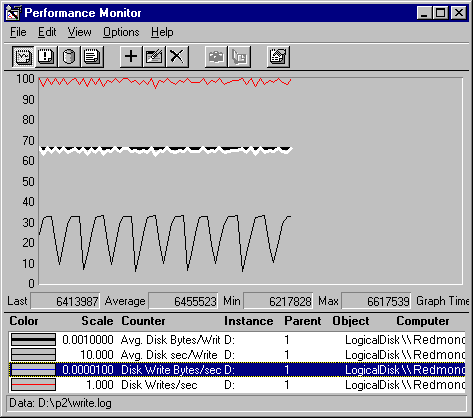
As expected, the dips in the graph are eliminated. The overall transfer rate is also somewhat improved, although writing a log doesn't have that much overhead. Whenever possible, isolate your tests on a single physical drive. Also, if you have a high-priority task, or an I/O intensive application, designating a separate physical drive for the task will improve overall disk performance.