All other things being equal, it is quicker and more efficient to read a few large records than many small ones. Although this seems obvious, it is vital to disk performance. If your applications are efficient in their I/O strategy, in localizing data access, and in minimizing repeated I/O requests, the application, the disk, and the computer will function more efficiently.
You can test how your computer responds to reading and writing in smaller and larger units. The Windows NT Resource Kit 4.0 CD includes Diskmax, a Response Probe test of maximum throughput which reads 64K records and Minread, a Response Probe test for reading in 512-byte records. The tests are on the Windows NT Resource Kit 4.0 CD in the Performance Tools group in the \Probe subdirectory. Instructions for running the tests are in Diskmax.txt and Minread.txt.
Note
The Minread tests use 512-byte records as the minimum record size because unbuffered reads must be done in sectors, and 512-bytes is a common disk sector size. If your disk has a different sector size, substitute that value for 512 in the RECORDSIZE parameter of the Minread.sct file.
To find the sector size of your disk, use Windows NT Diagnostics in the Administrative Tools group. Select the Drives tab, double-click the drive letter to open the Properties page, then select the General tab. Sector size is listed along with other useful information.
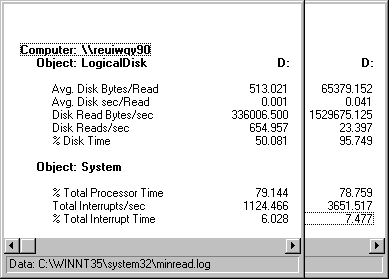
The following figure displays the extremes. It compares the results of the Minread and Diskmax tests run on the same drive of the same computer. Performance Monitor was writing its log to a different physical drive. Both tests show Response Probe doing unbuffered reads of sequential records from a 20 MB file.
The figure was created by superimposing two Performance Monitor reports of the same counters. The data in the first column shows Response Probe reading 512-byte records. The data in the second column shows Response Probe reading 64K records. Avg. Disk Bytes/Read, the size of each read from the disk, is set by the test. The other values vary with the efficiency of the system.
In this example, larger reads improved throughput substantially, but the transfer rate dropped as more of the disk time was consumed. While reading smaller records, the disk was only busy 50% of the time, so it could have been shared with another process. It managed 655 reads per second on average, at a quick 0.001 seconds per read. Reading the larger records, the disk was almost 96% busy, reading only 23.4 times/sec at 0.041 seconds per read.
Total throughput was much better for larger records. Disk Read Bytes/sec was 336K bytes per second on average for the small records and 1.5 MB/sec for the large records.
Interrupts/sec at 1124.466 were close to the expected 1 per sector for this disk, as shown in the following table. Note that although interrupts were high, they amounted to a small proportion of disk time. Some of the interrupts might not have been serviced.
Interrupts on small records | Interrupts on larger records | ||
| |||
Total interrupts/sec | 1124 | 3651.5 | |
System clock interrupts/sec | (100) | (100) | |
Network interrupts/sec | (300) | (300) | |
Subtotal | 724 | 3251.5 | |
Bytes/sec | 335006.5 | 1529675 | |
Bytes/interrupt | 462.7 | 470.45 | |
In this system, 100 interrupts per second are generated by the processor clock and about 300 interrupts per second are generated by the network. Thus, 724 interrupts per second can be attributed to disk activity while reading smaller records or about 1 interrupt for every 463 bytes (336006.5 / 724) on average. For larger records, 3252 interrupts per second are likely to be caused by disk activity or 1 interrupt for every 470 bytes (1529675.125 / 3252).
One important value, elapsed time, is not shown in the report, but can be calculated, at least roughly, from values that are shown. To read a 20 MB file in 512-byte chunks would take 40,000 reads. At about 655 disk reads per second, that would take longer than minute. ( (20,048,000 / 512) / 655 = 61 seconds) To read the same file in larger records, even at the slower rate would take only just over 13 seconds (((20,480,000 / 65536) / 23.4) = 13.34).
This test of the extremes of record size performance used sequential reading with no memory access. To test within and beyond this range, copy and edit the Diskmax and Minread files.
For more information on Response Probe, see "Response Probe" in Chapter 11, "Performance Monitoring Tools."
Another interesting test is to read records of gradually increasing size. You can see how the system responds to the change in requirements.
In this test, a test tool was set up to do unbuffered, sequential reads from a 40 MB file. It did three reads each of 2K, 8K, 64K, 256K, 1024K, 4096K and 8192K records with a 5-second interval between cluster of three reads.
Note
The Windows NT Resource Kit 4.0 CD includes all the files you need to use Response Probe to test the performance of your disk while reading records of increasing size. The Sizeread test is controlled by an MS-DOS batch file which runs a series of Response Probe tests. To run Sizeread, use Setup to install the Performance Tools group from the CD. The test files are in the Probe subdirectory. Instructions for running the test are in Sizeread.txt.
The following graphs show the data. The first two graphs show values for the smaller records, 2K, 8K, and 64K. Values for the larger files appear to stop at 100, but actually go off of the top of the graph. The last graph in this section shows values for the larger records, 256K, 1024K, 4096K, and 8192K. In these graphs, values for the smaller record sizes run along the bottom of the graph. Throughout the test, Performance Monitor was logging to a different physical drive.
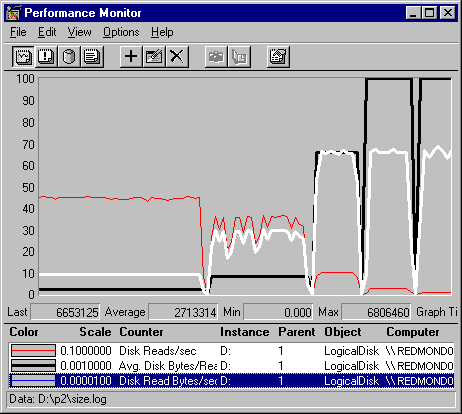
In this graph, the gray line is Disk Reads/sec, the black line is Avg. Disk Bytes/Read, and the white line is Disk Read Bytes/sec. As the record size (Avg. Disk Bytes/Read) increases, the throughput (Disk Read Bytes/sec) increases and the transfer rate (Disk Reads/sec) falls because it takes fewer reads to move the same amount data. At 8K, the reading performance wobbles as the system runs short of memory, then recovers. Above 64K, the values are greater than 100 and go beyond the top of the graph.
The following graph shows the affect of the disk activity on the processor.
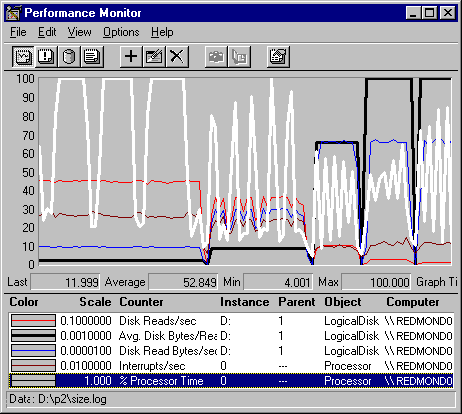
In this graph, Processor: % Processor Time (the white line) is added to the graph, along with Interrupts/sec. The processor time curve shows that the processor is used more frequently as throughput increases, but the amount of processor time decreases as the record size increases. This value is characteristic of the architecture of this disk, which interrupts for each read, not for each sector. On disks that interrupt at each sector, the pattern would be quite different.
The patterns seem to fall apart at record sizes greater than 64K bytes. The processor use begins to increase, and throughput rate hits a plateau and remains there.
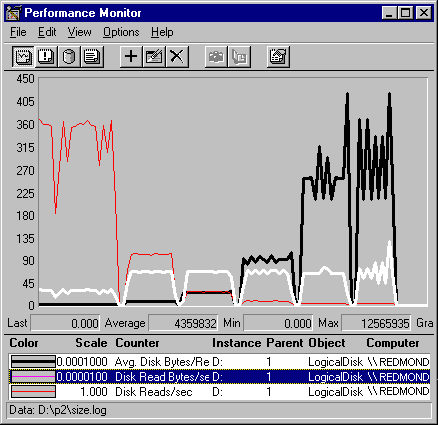
This graph is designed to show the larger values. The counters are scaled quite small, and the vertical maximum on the graph is increased to 450. The thick, black line (Avg. Disk Bytes/Read) represents the record size. The white line is the throughput, in Disk Read Bytes/sec. The gray line is transfer rate, in Disk Reads/sec.
The scales are so small that the first few record size variations just appear as close to zero. The first noticeable bump is 64K, the next is the attempt at 256K, then 1024K, 4096K and 8192K. The disk adapter cannot handle the higher disk sizes, so the actual values are closer to 252K, 900K, then 6.5M for both 4096K and 8192K.
What is clear from this otherwise busy graph, is that maximum throughput is reached at 64K and does not increase any further with record size, although the transfer rate continues to fall as the buses are loaded with larger and larger records.
The actual values are best shown on this Excel spreadsheet. It was prepared by using a single copy of Performance Monitor with a graph of Avg. Disk Bytes/Read in Chart view, and a report of the Logical Disk and Processor counters was created in Report view. In Chart view, the Time Window was adjusted to limit the values to a single record size segment, then the values were read from report view and entered into the spreadsheet. The procedure was repeated for each record size segment of the chart.
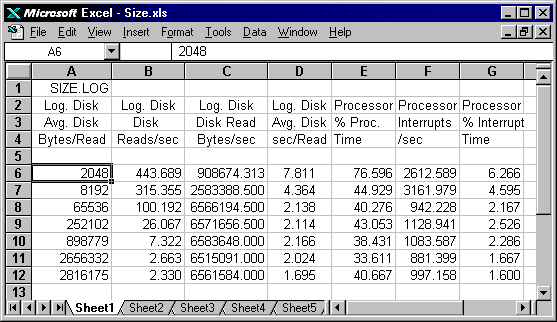
This spreadsheet reveals the I/O strategy of this system. When transferring data blocks greater than 64K, it breaks the transfers into 64K chunks. Above 64K, the transfer rate drops sharply, and throughput sticks at 6.5 MB. The buffer size appears to be at its maximum at an average record size of 2.8 MB, although the largest record transferred was 4.194 MB. (To determine the largest record size, use the time window to limit the graph to the single highest value on the chart, then read the Max value from the value bar.)
Processor use and interrupts also appear to level off at 64K. The remaining variation is just as likely to be due to sampling. It is beyond the resolution of this tool.
This is just an example of what you can test. Remember to use different applications and test tools and combine all results in your analysis. Save the data to show long term trends in disk performance, especially if your workload changes or memory or disks are upgraded.