JBJBIt is useful to monitor the size of the paging file, Pagefile.sys, when investigating memory shortages. On systems that have relatively little excess memory, an increased demand for memory causes Windows NT to expand the paging file.
The pagingMESMES file, Pagefile.sys, is a block of disk space reserved by the operating system to back up physical memory. When processes require more physical memory than is available, the Virtual Memory Manager frees up space in memory by writing less-frequently-referenced pages back to the paging file on disk. As demand for memory increases, the Virtual Memory Manager expands the paging file until it runs out of disk space or reaches the paging file reaches its maximum size.
Note
Windows NT creates one paging file on the physical drive on which the operating system is installed. The default size is equal to physical memory plus 12 MB. You can change the size of the paging file, and you can create one additional paging files on each logical disk partition in your configuration.
Use the Control Panel System applet Performance tab. (Right-click My Computer, select Properties, then select the Performance tab.) The Virtual Memory box shows the current size of your paging files and lets you add new files or change the size of existing ones. To change the value, click the Change button to display the Virtual Memory window, and then click Set.
To observe the changing size of the paging file, chart Process: Page File Bytes for individual processes and Process: Page File Bytes: _Total, an instantaneous measure of total number of bytes in the paging file.
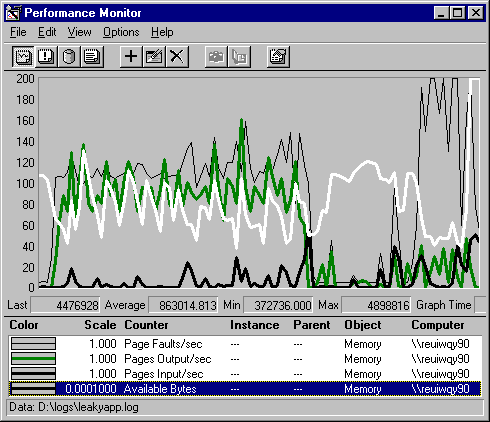
The data in the following graph was logged during a memory leak (when memory is allocated faster than it is freed). A testing tool, LeakyApp, was run to allocate as much memory as it could, and the thrashing at the end of the graph shows the system running out of virtual memory and repeatedly warning the user.

In this graph, the thin black line is Page Faults/sec. The next thick black line is Pages Output/sec. The thick white line is Available Bytes, and the thick black line at the bottom is Pages Input/sec.
The relatively low rate of pages input (those read from disk to satisfy page faults) and very high rate of pages output (those written back to disk to trim working sets and recover physical memory) reveals the strategy of the Virtual Memory Manager to conserve available bytes by writing pages from physical memory to the paging file. Even as physical memory is consumed by processes, the number of available bytes of memory rarely falls below 4 MB, though it might vary rapidly and considerably within its range. In this example, Available bytes never drops below 372,736 bytes, as indicated by the Min value on the value bar.
However, the paging file on disk (Pagefile.sys) fills up rapidly until it runs out of space on disk.

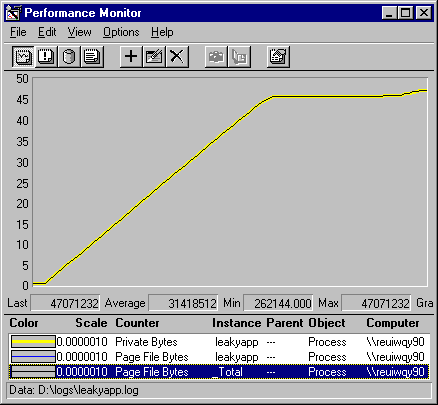
In this graph, the lines representing the private bytes LeakyApp allocated to itself, the size of the paging file used by LeakyApp, and the total number of used bytes in the paging file, are all superimposed upon each other.MESMES Although the values are not identical, they are quite similar.
The graph is evidence of the significant growth of the paging file during a memory shortage. The plateau on the graph indicates that the maximum size of the paging file was reached, and LeakyApp could no longer allocate additional memory.
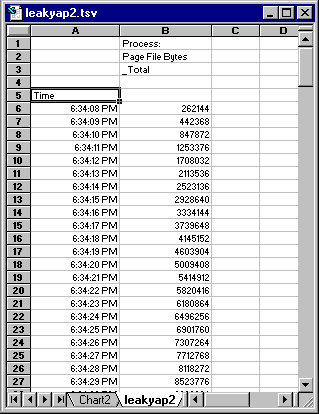
To see the values of all data points of the Page File Bytes curve, export the data to a spreadsheet like Microsoft Excel. For details on exporting logged data, see "Exporting Data" in Performance Monitor Help.
