Seek operations affect writing to disk as well as reading from it. Use the following counters to measure and compare the effects of writing sequential records to writing randomly throughout the disk:
Remember to defragment your disk before testing. If your disk is nearly full, the remaining free space is likely to be fragmented, and the disk must seek to find each sector of free space. The efficiencies won by writing sequential records will be lost in the added seek time.
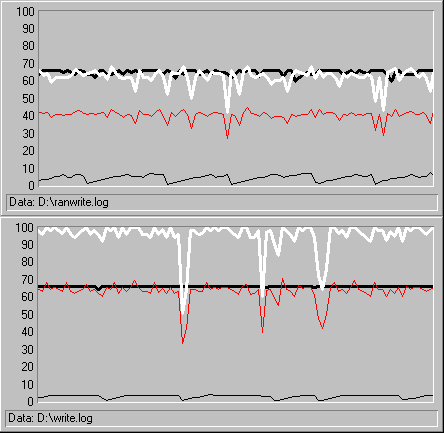
The following figure compares random to sequential writing on the same disk. In the top graph, the disk is writing 64K records randomly throughout a 60 MB file. In the bottom graph, the same disk is writing the same size records to the same size file, but is writing sequentially. In both cases, Performance Monitor is logging to a different partition on the same physical disk.

In both graphs, the white line is Disk Writes/sec, the thick, black line is Avg. Disk Bytes/Write, the gray line is Disk Write Bytes/sec, and the thin, black line near the bottom is Avg. Disk sec/Write.
The pattern of seek and read that was evident on the graph of random reading does not appear in this graph of random writing. In fact, the shapes of the random and sequential writing counter curves are quite similar, but their values are very different. Disk Writes/sec and Disk Write Bytes/sec are both 50% higher on the sequential writing test, an even greater effect than on the reading test.
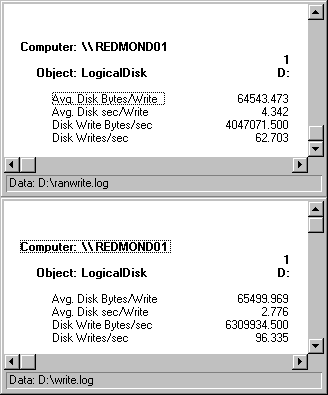
The following comparison of reports makes this more evident. The top report is of the random writing test; the bottom report is of the sequential writing test.

When writing throughout the disk, the transfer rate, as measured by Disk Writes/sec, drops from 96.335/sec to 62.703/sec on average. Disk Write Bytes/sec drops also by one-third, from 6.3 MB/sec to 4.0 MB on average.