Windows NT Workstation supports most hardware RAID configurations and stripe sets without parity. Testing the performance of these volume sets is much like testing single disk. The Response Probe tests used to measure single disks can also be run on any disk in a stripe set and on the virtual volume that hardware RAID exposes to Windows NT.
To test your volume sets, use the following counters:
Note
The equivalent counters for measuring writing (for example, Avg. Disk Write Bytes/sec) are used to test the performance of volume sets while writing to disk. The values for reading and writing in our tests were so similar that showing the writing test added little value. However, you can use the same methods to test writing to disk on your volume sets.
These reading tests were run on a stripe set of four physical disks. Disks 0, 1, and 2 are on a single disk adapter, and Disk 3 is on a separate adapter. Performance Monitor is logging to Disk 3. In each test, the test tool is doing unbuffered, sequential reads of 64K records from a 60 MB file on a FAT partition. The test begins with reading only from Disk 0. Another physical disk was added with each iteration of the test to end with 4 stripes. During the test, Performance Monitor was logging data to Stripe_read.log, which is included on the Windows NT Resource Kit 4.0 CD.
Tip
The logs recorded during these tests are included on the Windows NT Resource Kit 4.0 CD in the Performance Tools group. The logs are Stripe_read.log (sequential reading), Stripe_rand.log (random reading), and Stripe_write.log (sequential writing). Use Performance Monitor to chart the logs and follow along with the discussion that follows. The logs include data for the Processor, Logical Disk, and Physical Disk objects, so you can add more counters than those shown here.
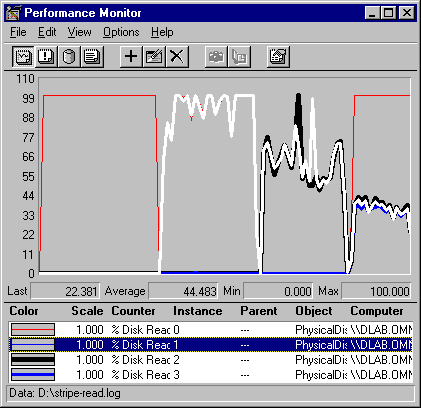
The following graph shows an overview of the test, and the disk time contributed by each disk to the total effort. In the first segment of the graph there is one disk, the second, two disks; the third, three disks; and the fourth, four disks.

The graph consists of Physical Disk: % Disk Read Time for all disks in the stripe set. The thin gray line represents Disk 0, the white line is Disk 1, the heavy black line is Disk 2, and the heavy gray line is Disk 3. The striping strategy apportions the workload rather equally in this case, so the lines are superimposed upon each other. This graph is designed to show that, as new disks were added to the test, each disk needed to contribute a smaller portion of its time to the task.
The following table shows the average values of Avg. Disk Read Queue Length, a measure of disk time in decimals, for each disk during each segment of the test.
# Stripes | Avg. Disk Read Queue Length | ||||
Disk 0 | Disk 1 | Disk 2 | Disk 3 | ||
1 | 58.673 | 0 | 0 | 0 | |
2 | 1.047 | 1.054 | 0 | 0 | |
3 | 0.603 | 0.639 | 0.645 | 0.000 | |
4 | 1.562 | 0.366 | 0.377 | 0.355 | |
This table shows how the FTDISK, the Windows NT fault tolerant disk driver, distributes the workload among the stripes in the set, so each disk requires less time. The exception is Disk 0 which has a disproportionate share of the activity during the last stage of the test.
The following graph shows the effect of their combined efforts in the total work achieved by the stripe set.
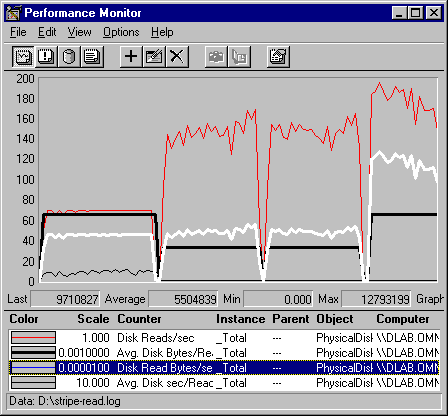
In this graph, the gray line is Disk Reads/sec: Total, the heavy black line is Avg. Disk Bytes/Read: Total, the white line is Disk Read Bytes/sec: Total and the thin, black line at the bottom is Avg. Disk sec/Read: Total. The vertical maximum on the graph is increased to 200 to include all values.
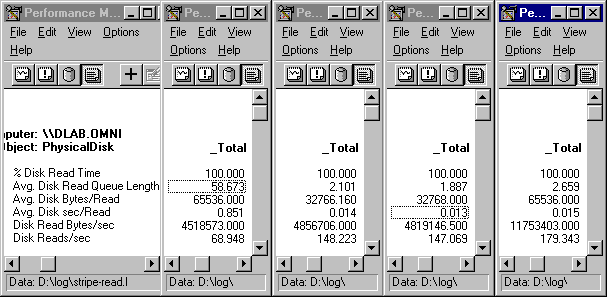
The following figure shows the average values for each segment of the test.
Tip
To produce a figure like this, open four copies of Performance Monitor and chart the counters you want to see for all available instances. The first copy is used just to show the counter names. Use the time window to set each copy of Performance Monitor to a different time segment of the test. Then, you can scroll each copy to the instance you want to examine in that time segment. In this example, the Total instance is shown for all time segments.
The graph and reports show that the transfer rate (Disk Reads/Sec: Total) is most affected by adding stripes to the set. It increases from an average of 69 reads/sec on a single disk to an average of 179 reads per second with four stripes. Throughput (Disk Read Bytes/Sec: Total) increases from an average of 4.5 MB per second to 11.75 MB/sec with four stripes.
Note that there is almost no change in the values upon adding the third stripe, Disk 2, to the set. The total transfer rate increases significantly with the addition of the second disk, but not at all with the third disk. Throughput, which is 4.5 MB with one disk, inches up to an average of 4.8 MB, then stays there until the fourth disk is added.
We cannot measure it directly, but it appears that this plateau is caused by a bottleneck on the disk adapter shared by Disks 0, 1, and 2. Although each of the physical disks has a separate head stack assembly, they still share the adapter. Shared resource contention is one of the limits of scalability. Multiple computers share the network, multiple processors share memory, multiple threads share processors, and multiple disks share adapters and buses. Fortunately, we can measure it and plan for future equipment needs.
The following graph shows how each disk is affected when stripes are added to the set. While the totals go up, each disk does less work. Potentially, it has time available for other work.
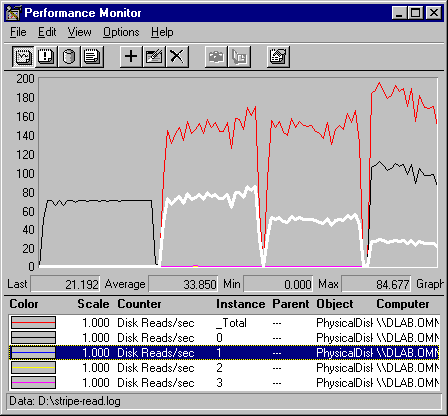
This is a graph of the transfer rate, as measured by Disk Reads/sec. The gray line is Disk Reads/Sec: Total, the black line is Disk Reads/sec: Disk 0, and the white line is Disk Reads/sec: Disk 1. The lines for Disks 2 and 3 run along the bottom of the graph until they are added, and then they are superimposed on the line for Disk 1.
The average values are:
#Stripes | Disk Reads/sec | |||||
Disk 0 | Disk 1 | Disk 2 | Disk 3 | Total | ||
1 | 68.948 | 0.000 | 0.000 | 0.000 | 68.948 | |
2 | 74.107 | 74.107 | 0.000 | 0.010 | 148.223 | |
3 | 49.020 | 49.020 | 49.020 | 0.000 | 147.069 | |
4 | 102.487 | 25.619 | 25.619 | 25.619 | 179.343 | |
These averages are a fairly good representation of the strategy of the stripe set controller as it distributes the workload equally among the stripes in the set. Each disk does less work, and the total achieved increases two and half times. Note that the transfer rate did not increase fourfold; the difference is likely to be related to sharing of resources.
The cause of the exceptional values of Disk 0, which appear in every test, are not entirely clear. They probably result from updates to the File Allocation Table. The tests were run on a FAT partition which was striped across all participating drives. In each case, the File Allocation Table is likely to be written to the first disk, Disk 0. Because the File Allocation Table is contiguous and sequential, Disk 0 can perform at maximum capacity. It appears that distributing the load to the other disks let Disk 0 double its productivity in the last sample interval. More research will be required to determine what happened.
The next graph shows that the same pattern holds for throughput. As more stripes are added, the total throughput increases, and the work is distributed across all four disks. This data also shows the disproportionate workload on Disk 0.
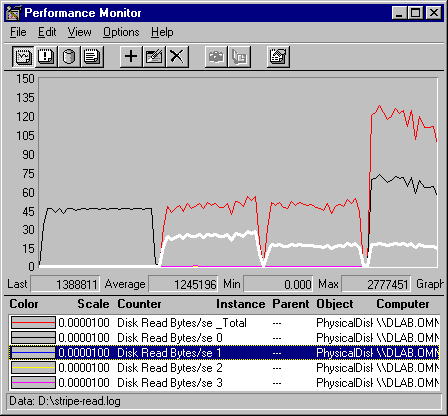
This is a graph of disk throughput, as measured by Disk Read Bytes/sec. The gray line is Disk Read Bytes/sec: Total, the black line is Disk Read Bytes/sec: Disk 0, the white line is Disk Read Bytes/Sec: Disk 1. Again, the lines for Disks 2 and 3 run along the bottom of the graph until they are added, and then they are superimposed on the line for Disk 1.
This table shows the average throughput, in megabytes, for each disk as the test progresses.
#Stripes | Disk Read Bytes/sec | |||||
Disk 0 | Disk 1 | Disk 2 | Disk 3 | Total | ||
1 | 4.52 | 0.00 | 0.00 | 0.00 | 4.52 | |
2 | 2.43 | 2.43 | 0.00 | 0.000039 | 4.86 | |
3 | 1.61 | 1.61 | 1.61 | 0.00 | 4.82 | |
4 | 6.72 | 1.68 | 1.68 | 1.68 | 11.75 | |
The pattern, quite reasonably, is very similar to that for the transfer rate. The workload is distributed evenly and the total throughput rate achieved increases by 2.6%. Disk 0 is still doing a disproportionate share of the work (57%), which probably consists of its share of the read operations plus updating the FAT table.