When memory is scarce, more data must remain on the disk. Accordingly, page faults are more likely. Similarly, when the cache is trimmed, cache hit rates drop and cache faults increase. Cache faults are a subset of all page faults.
Note
The operating system sees the cache as the file system's working set, its dedicated area of physical memory. When data isn't found in the cache, the system counts it as a page fault, just as it would when data was not found in the working set of a process.
To monitor the effect of cache bottlenecks on disk, use the following counters:
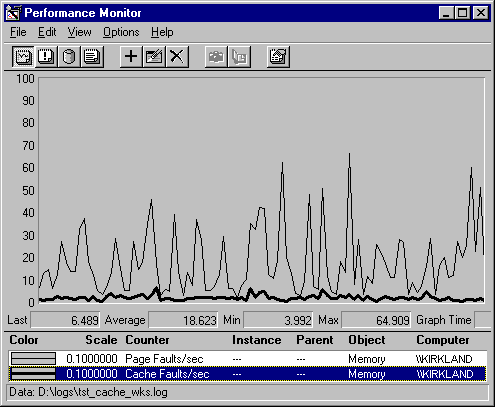
The following graph shows the proportion of page faults that can be traced to the cache. Cache Faults/sec includes data sought by the file system for mapping as well as misses in copy reads for applications. Because both the Cache Faults/sec and Page Faults/sec counters are measured in numbers of pages, they can be compared without conversions.

In this example, the thin black line represents all faulted pages; the thick black line represents pages faulted from the cache. Places where the curves meet indicate that nearly all page faults are cache faults. Space between the curves indicates faults from the working sets of processes. In this example, on average, only 10% of the relatively high rate of page faults happen in the cache.
The important page faults, however, are those that require disk reads to find the faulted pages. But the memory counters that measure disk operations due to paging make no distinction between the number of reads or pages read due to cache faults and those caused by all faults.

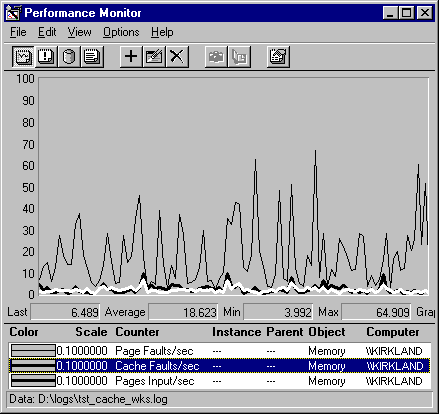
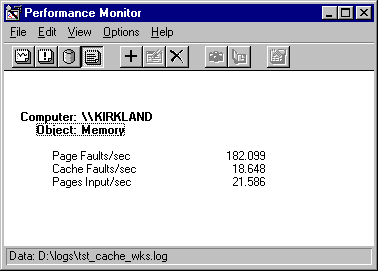
This graph and the report that follows show that most faulted pages are soft faults. Of the average of 182 pages faulted per second, only 21.586less than 12%are hard faults. It is even more difficult to attribute any of the pages input due to faults to the cache.
